To open long positions on GBP/USD, we need the following conditions:
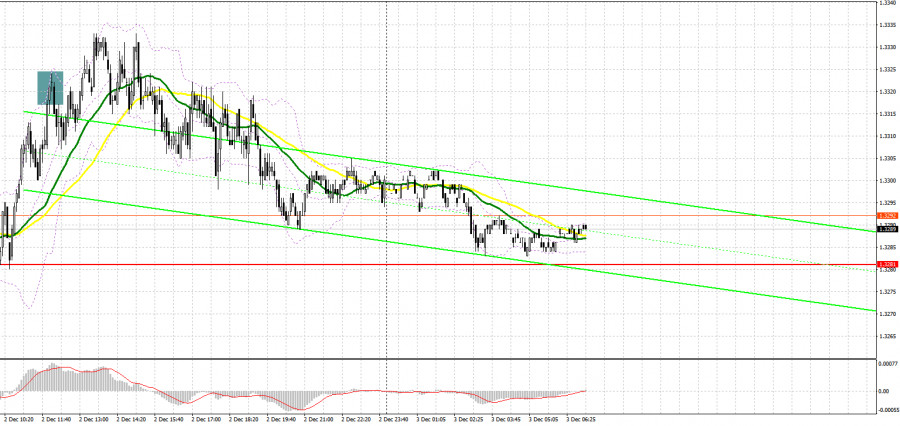
The fact that the price is steadily holding at the support level of 1.3277 indicates the presence of big investors in the market. This level is extremely important for the further movement of the pair. Before presenting the technical analysis for today, let's look at the 5M chart and figure out what happened yesterday. The pound sterling rose slightly in the first half of the day. It tried again to test the resistance of 1.3313. The upward movement is limited by this level. The pair failed to break through 1.3313, a false breakdown was formed, as well as a signal to open short positions. However, bears did not take advantage of the situation. There were no other entry points as the price did not reach any of the indicated levels.

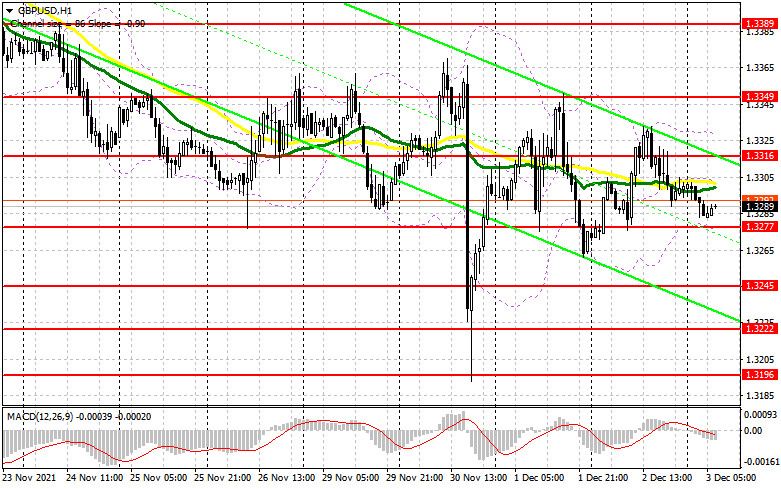
Today, the UK will unveil the Services PMI Index. If the figure is positive, the pound sterling may gain momentum. However, to start a strong upward correction, bulls need to accumulate strength to push the pair higher. To begin with, they need to regain control over the resistance level of 1.3316. New long signals may appear amid the downwards test of this level and a strong report on the UK services PMI Index for November. It may limit the downward movement, pushing GBP/USD to 1.3349, which is the upper limit of the sideways channel. If bulls quickly break this level, the next target level will be a high of 1.3389. It is recommended to lock in profits at this level. The resistance level of 1.3417 remains a longer-term target level. The price may reach this level if NFP data for November turns out to be weak and unemployment rises. If the pound sterling slides during the European session, bulls need to protect the support level of 1.3277, which is crucial for its future trend. We should wait for an entry point to open long positions only after the formation of a false breakdown. It is better to open long positions on GBP/USD immediately after a bounce off a low 1.3245 or from 1.3222, bearing in mind a 20-25 pip intraday correction.
To open short positions on GBP/USD, we need the following conditions:
Bears seem to be trying to regain ground. However, they are lacking strength. They managed to affect the price only after it faced a strong resistance level. The pair is unlikely to break below 1.3277, which indicates the weakness of a bearish bias. Their primary goal is to protect the resistance level of 1.3316. A new entry point to open short positions may appear only after the formation of a false breakdown at this level as well as weak data on the UK Services PMI. The price may decline to the lower border of the sideways channel of 1.3277. A breakout of this level will increase pressure on bulls. The upwards test of 1.3277 will give an excellent entry point, which will push the pair to new lows of 1.3245 and 1.3222. I recommend profit taking. The support level of 1.3196 will be a more distant target level. The price will be able to approach it if the NFP report turns out to be upbeat. The stabilization of the labor market will force the Fed to speed up the QE tapering. If the pair rises in the European session and sellers do not push the price below 1.3316, it is best to postpone sales until the quotes reach the resistance level of 1.3349. This resistance level also acts as the upper border of the sideways channel. The most sensible solution to sell GBP/USD would be selling straight after a false breakdown. It is possible to sell GBP/USD immediately after a bounce off a strong resistance level of 1.3389 or from 1.3417, counting on a 20-25 pip intraday correction.

COT report
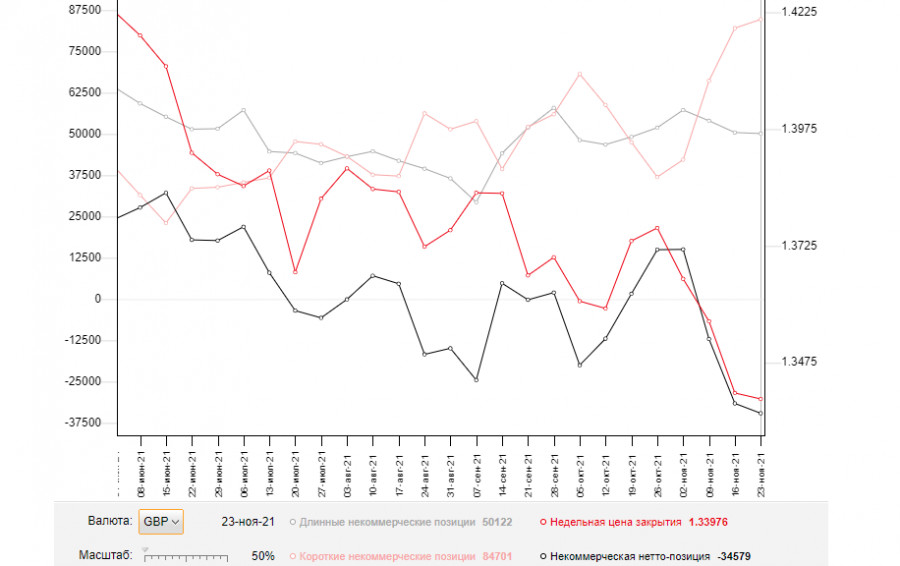
The COT reports (Commitment of Traders) for November 23 showed an increase in short positions and a decline in long ones, which led to an even bigger rise in the negative delta. Dovish statements made by the BoE governor last week dragged down the pound sterling amid risks associated with higher than expected inflationary pressure. The worsening epidemiological situation and the spread of the new omicron strain in the EU are also weighing on the market sentiment. The final decision on the Northern Ireland protocol, which the UK authorities plan to suspend, is also unknown. At the same time, in the United States, inflation keeps growing. Economists are widely discussing the possibility of an earlier interest rate hike, which is bullish for the US dollar. However, I recommend sticking to the strategy of opening long positions on the pair at sharp falls, which may occur amid uncertainty over the Fed's monetary policy. The COT report unveiled that the number of long non-profit positions decreased to 50,122 from 50,443, while the number of short non-profit positions rose to 84,701 from 82,042. This led to an increase in the number of the negative non-commercial net position: the delta totaled 34,579 against -31,599 a week earlier. The weekly closing price dropped to 1.3397 from 1.3410.

Signals of technical indicators
Moving averages
EUR/USD is trading slightly above 30- and 50-period moving averages. It means that the bulls don't give up attempts to carry on with an upward correction.
Remark. The author is analyzing a period and prices of moving averages on the 1-hour chart. So, it differs from the common definition of classic daily moving averages on the daily chart.
Bollinger Bands
If the price resumes the upward movement, the upper limit of the indicator around 1.3330 will act as resistance. A breakthrough of the lower limit of the indicator at 1.3277 will trigger further drop of the pair.
Definitions of technical indicators
- Moving average recognizes an ongoing trend through leveling out volatility and market noise. A 50-period moving average is plotted yellow on the chart.
- Moving average identifies an ongoing trend through leveling out volatility and market noise. A 30-period moving average is displayed as the green line.
- MACD indicator represents a relationship between two moving averages that is a ratio of Moving Average Convergence/Divergence. The MACD is calculated by subtracting the 26-period Exponential Moving Average (EMA) from the 12-period EMA. A 9-day EMA of the MACD called the "signal line".
- Bollinger Bands is a momentum indicator. The upper and lower bands are typically 2 standard deviations +/- from a 20-day simple moving average.
- Non-commercial traders - speculators such as retail traders, hedge funds and large institutions who use the futures market for speculative purposes and meet certain requirements.
- Non-commercial long positions represent the total long open position of non-commercial traders.
- Non-commercial short positions represent the total short open position of non-commercial traders.
- The overall non-commercial net position balance is the difference between short and long positions of non-commercial traders.


