To open long positions on EUR/USD, you need:
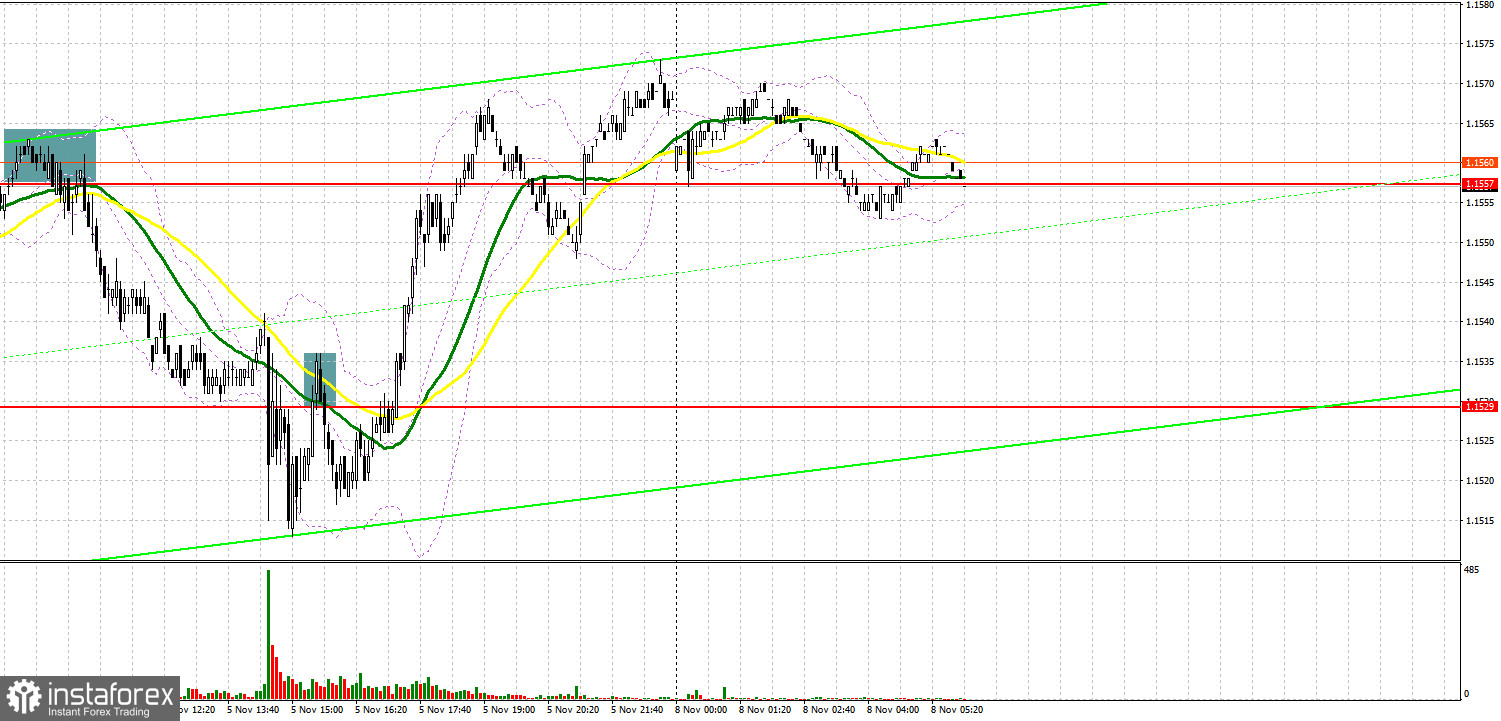
Several signals to enter the market were formed on Friday. Let's take a look at the 5 minute chart and see what happened. Even in the morning forecast, I paid attention to the 1.1557 level and advised you to make decisions on entering the market. Weak data on the eurozone returned the pressure to the pair. As a result, several unsuccessful attempts to break through 1.1557 were formed, which only resulted in forming a signal to sell the euro. Strong reports on the US labor market only strengthened the pressure for the pair, which fell from the entry point by more than 50 points. In the second half of the day, after the 1.1529 update from the bottom up, another signal to sell the euro was formed, however, after a slight movement of the pair down by 15 points, the bulls managed to turn the market over to their side, which led to a large upward correction in the euro.
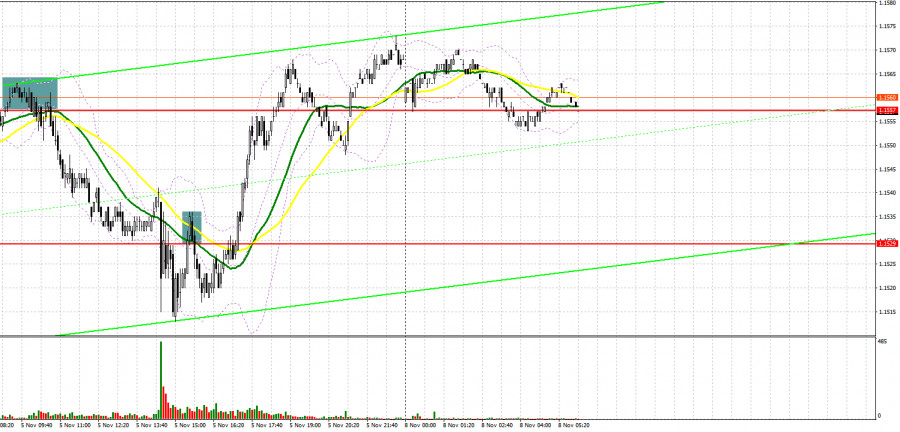
Despite all the market manipulations, the technical picture has not changed much. This morning we only have a report on the confidence of the eurozone investors. The sentiment has not been very good lately, so we can expect the indicator to decrease this fall, which will temporarily limit the euro's upward potential. However, the bulls will continue to rely on an upward correction in the pair, and a good performance in the eurozone may lead to a breakthrough of the resistance at 1.1557, above which it was not possible to get out of last Friday. Going beyond this level with a reverse test from top to bottom will provide an entry point to long positions, aiming for EUR/USD growth to the 1.1595 area, where I recommend taking profits. A breakthrough of this range will entirely depend on the speeches of the leaders of the European Central Bank and the Federal Reserve. A test of 1.1595 from top to bottom will lead to an additional buy signal and return to the area of the upper border of the wide horizontal channel at 1.1615. In case the pair is under pressure and we receive disappointing data on the eurozone, forming a false breakout in the 1.1549 area, where the moving averages playing on the bulls' side, pass, will provide an excellent signal to buy the euro with the goal of an upward correction. In case it is not active at 1.1549, it is best to wait for the formation of a false breakout in the 1.1527 area, but you can open long positions in EUR/USD immediately for a rebound from a low of 1.1494, or even lower - from 1.1454, counting on a correction of 15-20 points within the day...
To open short positions on EUR/USD, you need:
The bears showed themselves, but they failed to keep the market under their control. Now they need to think carefully about protecting the resistance at 1.1571. Only weak fundamental data for the eurozone, which will witness a decrease in investor confidence in October this year, as well as forming a false breakout at 1.1571 will result in creating a signal to sell the euro with the goal of falling to the intermediate support of 1.1549. It is unlikely that a tough struggle will unfold for this level, so its breakout and renewal from the bottom up forms an additional signal to open new short positions, followed by a fall in the pair to the 1.1527 area. A breakdown of this range will also lead to the demolition of bulls' stop orders, which will quickly bring EUR/USD to 1.1494, where I recommend taking profits. The next target will be the support at 1.1454. If the pair is growing in the first half of the day and there are no bears at the level of 1.1571, it is best to postpone selling until the test of the 1.1595 high. It is possible to open short positions immediately on a rebound in the expectation of a downward correction of 15-20 points from a large resistance at 1.1615.
I recommend for review:
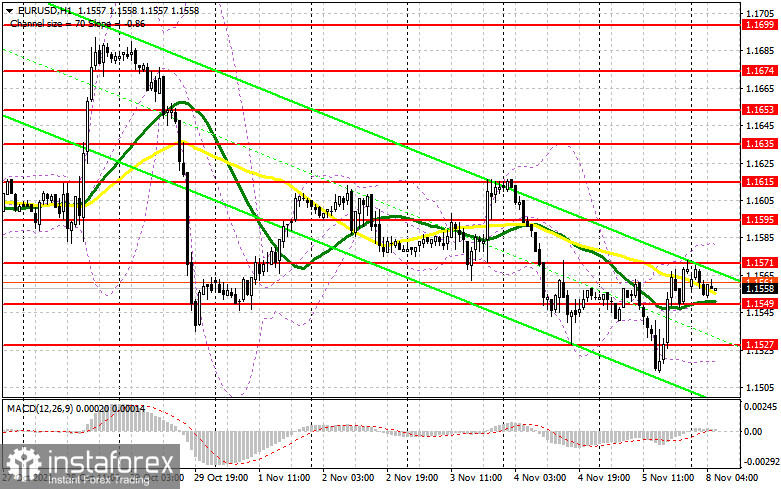
The Commitment of Traders (COT) report for October 19 revealed that both short and long positions declined, which led to a slight recovery in the negative delta, as more bears than bulls left the market than. Inflation in the eurozone came out last week, which rose and coincided with economists' expectations. This has forced many representatives of the European Central Bank to revisit the topic of changes in monetary policy. However, the fact that virtually everyone stuck to a wait-and-see attitude and retained stimulus measures in the form of bond purchases after the end of the PEPP program in March next year put some pressure on the European currency. The slowdown in manufacturing and services in the eurozone also prevented euro bulls from getting beyond the 17th figure. However, a key problem in the short term, negatively affecting the euro's growth, is the sharp spread of the fourth wave of coronavirus infection throughout the European Union. In the United States of America, the strong recovery in the economy continues to support the greenback. The fact that the Federal Reserve is already seriously considering curtailing the bond purchase program at its next meeting in November will also limit the euro's upside potential against the US dollar. The COT report indicated that long non-commercial positions fell from 202,512 to 193,320, while short non-commercial positions fell from 220,910 to 205,427 against -18 398. The weekly closing price rose to the level of 1.1613 against 1.1553.
Indicator signals:
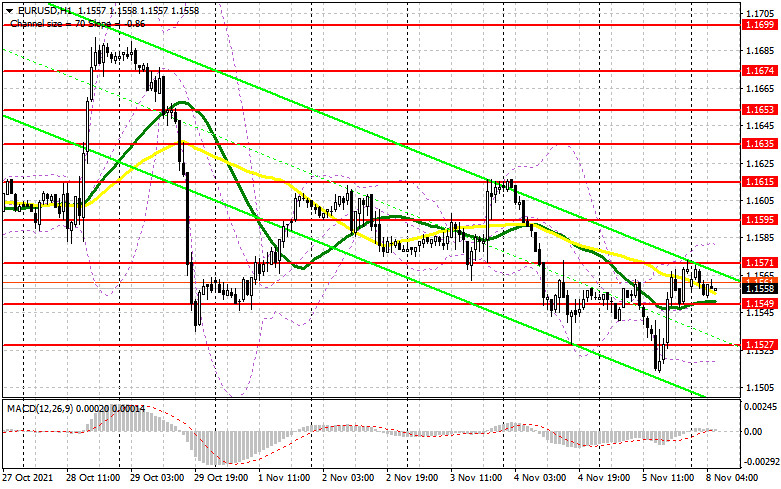
Trading is carried out above the 30 and 50 daily moving averages, which indicates an attempt by the bulls to build an upward correction.
Moving averages
Note: The period and prices of moving averages are considered by the author on the H1 hourly chart and differs from the general definition of the classic daily moving averages on the daily D1 chart.
Bollinger Bands
In case of growth, the upper border of the indicator in the area of 1.1580 will act as a resistance. The lower border of the indicator around 1.1520 will act as a support.
Description of indicators
- Moving average (moving average, determines the current trend by smoothing out volatility and noise). Period 50. It is marked in yellow on the chart.
- Moving average (moving average, determines the current trend by smoothing out volatility and noise). Period 30. It is marked in green on the chart.
- MACD indicator (Moving Average Convergence/Divergence — convergence/divergence of moving averages) Quick EMA period 12. Slow EMA period to 26. SMA period 9
- Bollinger Bands (Bollinger Bands). Period 20
- Non-commercial speculative traders, such as individual traders, hedge funds, and large institutions that use the futures market for speculative purposes and meet certain requirements.
- Long non-commercial positions represent the total long open position of non-commercial traders.
- Short non-commercial positions represent the total short open position of non-commercial traders.
- Total non-commercial net position is the difference between short and long positions of non-commercial traders.