Here are the details of the economic calendar for October 20:
The UK released its inflation data yesterday, where it recorded a slowdown in growth rates from 3.2% to 3.1%.
During the period of publication of statistical data, the value of the pound sterling declined.
Europe also published its inflation report at 9:00 Universal time, but since the final data fully coincided with the preliminary estimate, the market did not make any reaction.
Consumer prices in Europe rose from 3% to 3.4%.
Analysis of trading charts from October 20:
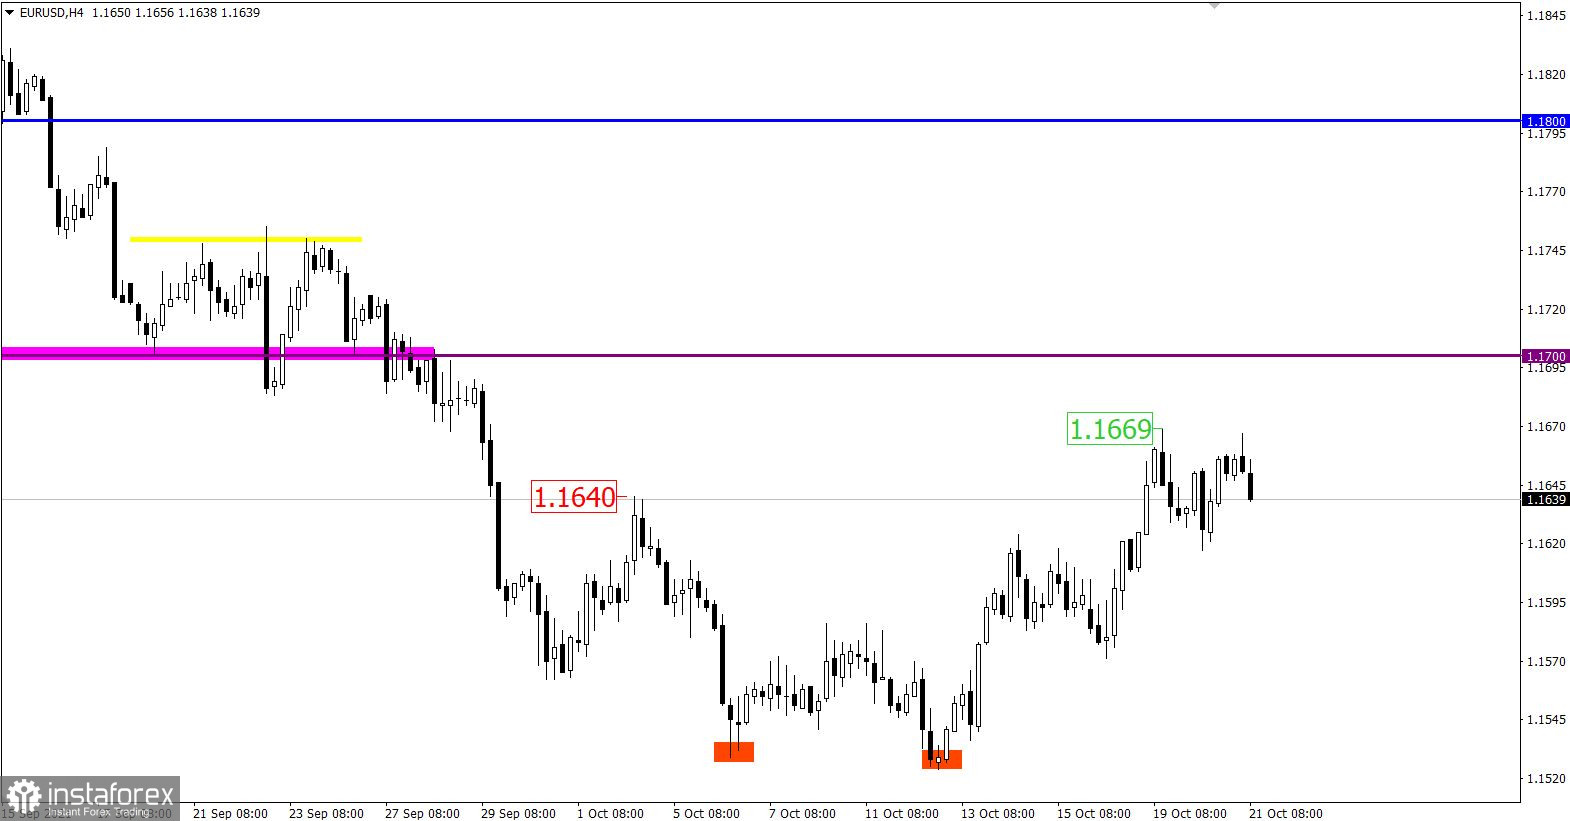
The EUR/USD pair follows the correction pattern from the support level of 1.1524, where the quote approached the area of the local high (1.1669) on October 19 once again.
Despite a fairly significant increase, the market continues to have a downward trend from the beginning of June. This suggests that the current correction is part of the trend.
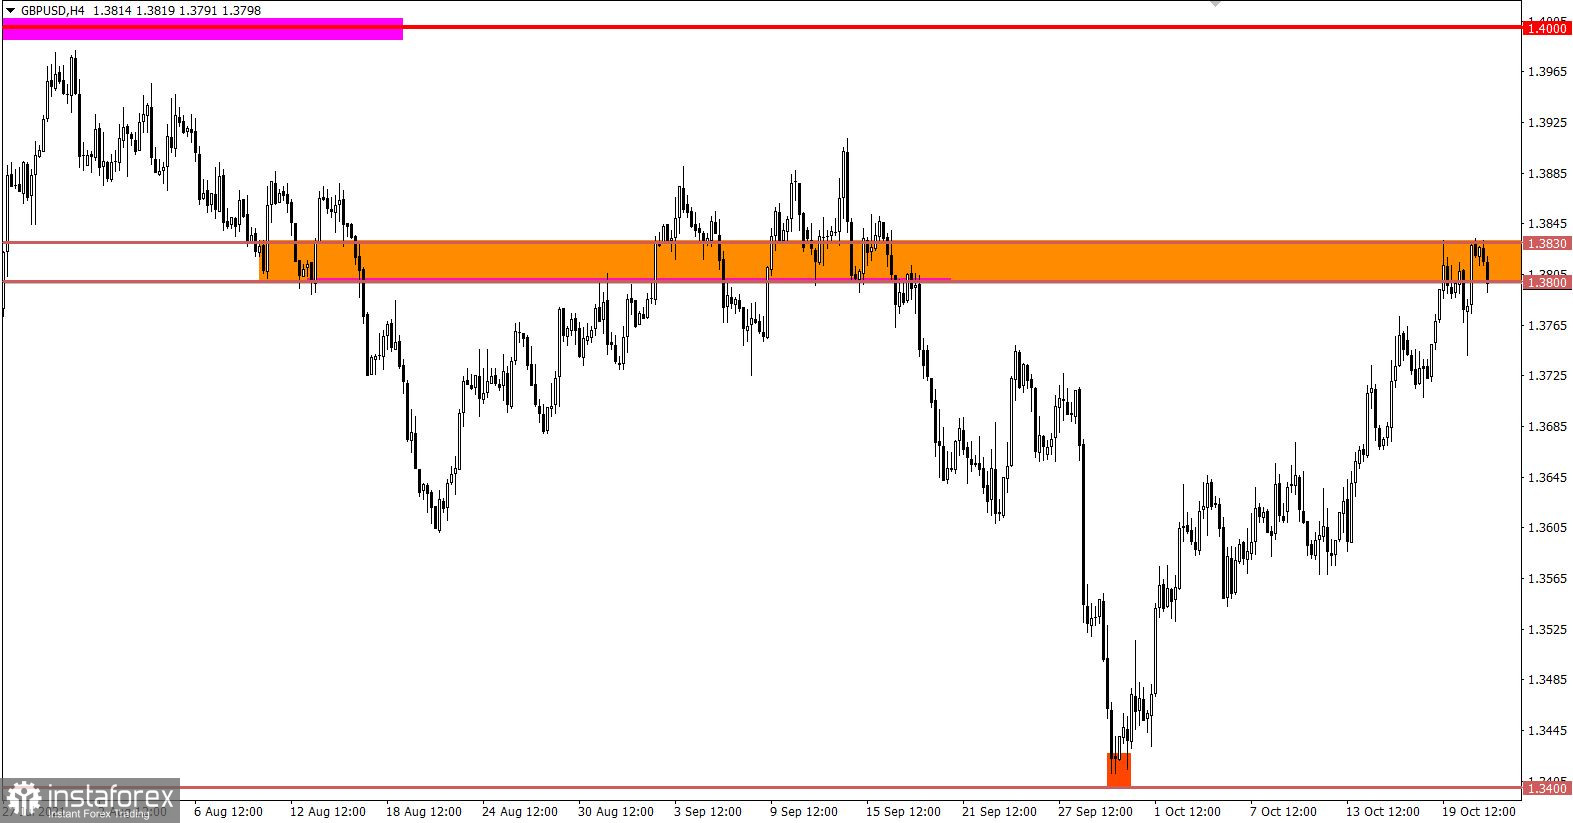
The GBP/USD pair is moving in the resistance area of 1.3800/1.3830, consistently reducing the volume of long positions. The correction scale from the pivot point 1.3400 is more than 400 points. This is a fairly strong price change, but it is still in the structure of the downward trend from the beginning of June. Thus, traders do not exclude that the resistance area of 1.3800/1.3830 may play the finish line for a correction, relative to which there will be a change of trading interests.
Short positions or Short means sell positions.
* The resistance level is the so-called price coordinate, from which the quote can slow down or stop the upward movement. The principle of constructing this level is to reduce the price stop points on the history of the chart, where a price reversal in the market has already taken place.
October 21 economic calendar:
Today, weekly data on applications for unemployment benefits in the United States will be published, where a reduction in the overall indicator is predicted.
Details of statistics:
The volume of initial applications for benefits may rise from 293 thousand to 300 thousand.
The volume of repeated applications for benefits may fall from 2,593 thousand to 2,550 thousand.
* Applications for unemployment benefits reflect the number of currently unemployed citizens and those receiving unemployment benefits. This indicator is considered to be the state of the labor market, where the growth of the indicator negatively affects the level of consumption and economic growth. The reduction of applications for benefits has a positive effect on the labor market.
Trading plan for EUR/USD on October 21:
Considering the local high on October 19 as a resistance level, then the quote may return to the levels of yesterday's low. The main sell signal will appear when the price is kept below the level of 1.1620 on a four-hour period. This step may indicate a change of trading interests, which will lead to the continuation of the downward cycle.
If the price is not kept below the level of 1.1620, an amplitude move is not excluded, which will lead to the formation of a flat.
* A flat is a sideways price movement.
Trading plan for GBP/USD on October 21:
It can be assumed that the resistance area of 1.3800/1.3830 puts pressure on buyers, which will eventually lead to the assurance of a correction. The first signal to sell the pound will arrive when the price is kept below the level of 1.3780, which will open the way towards 1.3730.
The most significant price changes will occur after holding the quote below the 1.3720/1.3700 area. This will strengthen the recovery course relative to the correction in the future.
What is reflected in the trading charts?
A candlestick chart view is graphical rectangles of white and black light, with sticks on top and bottom. When analyzing each candle in detail, you will see its characteristics of a relative period: the opening price, closing price, and maximum and minimum prices.
Horizontal levels are price coordinates, relative to which a stop or a price reversal may occur. These levels are called support and resistance in the market.
Circles and rectangles are highlighted examples where the price of the story unfolded. This color selection indicates horizontal lines that may put pressure on the quote in the future.
The up/down arrows are the reference points of the possible price direction in the future.