Here are the details of the economic calendar for October 5:
The European producer price index rose from 12.4% to 13.4%, which turned out to be slightly less than the forecasted 13.5%. The market did not react much, so the Euro currency stood in one place.
This was followed by the publication of the ISM index of business activity in the US services sector during the US trading session, where we saw an increase to 61.9 points instead of reducing its level from 61.7 to 60.0.
The US dollar reacted positively to the statistics.
Analysis of trading charts from October 5:
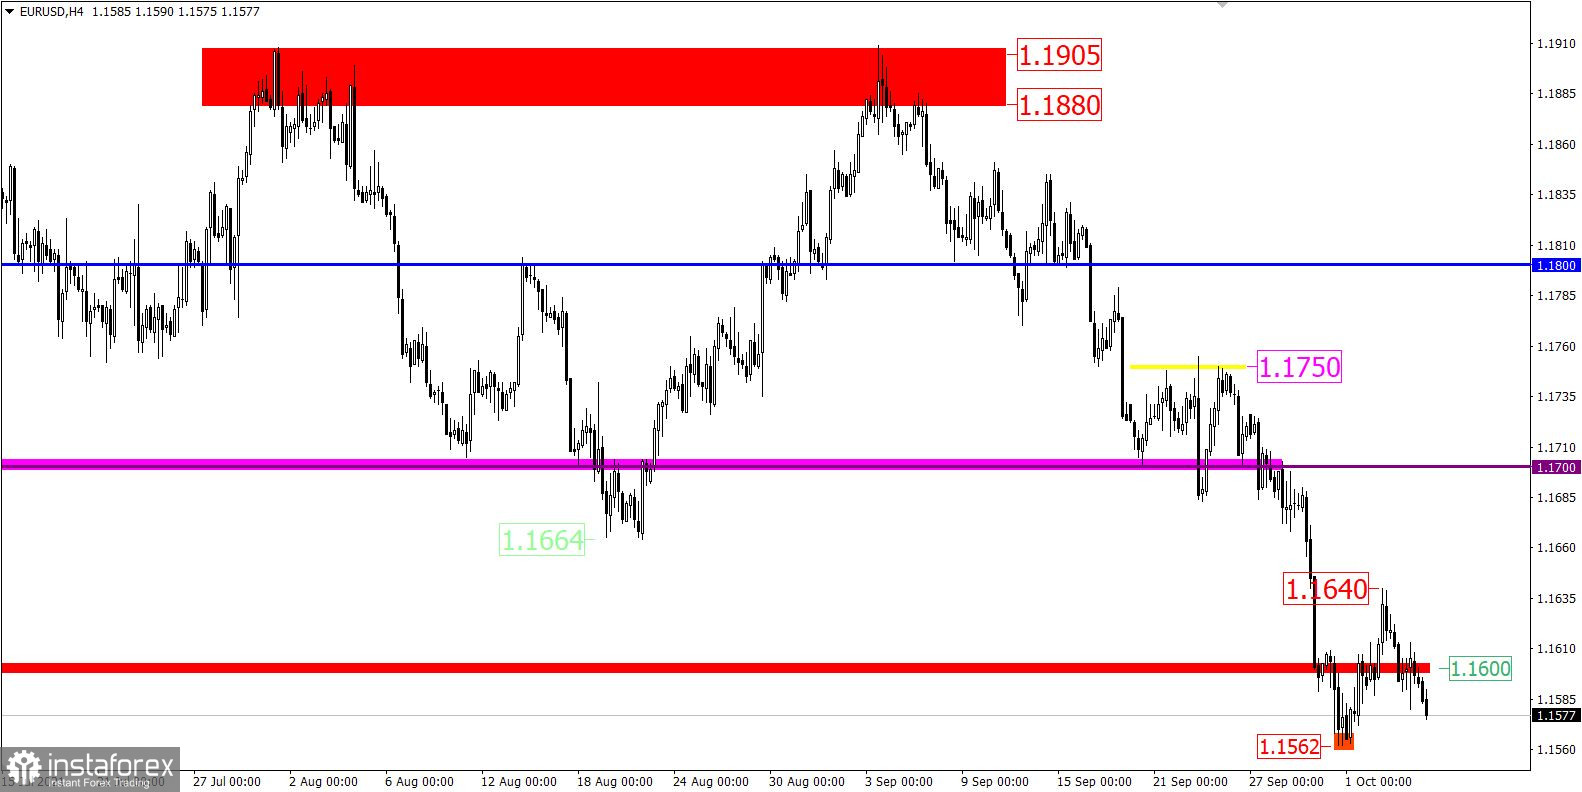
The EUR/USD pair reached the level of 1.1640 during the corrective movement from the pivot point 1.1562, where there was a stop and a reversal towards the level of 1.1600. The subsequent movement was in the form of a price stagnation within the borders of 1.1590/1.1615.
Considering the downward cycle from the beginning of June, there was a change of trading interests in the market. In the future, this may lead to a change in the medium-term trend in the market.
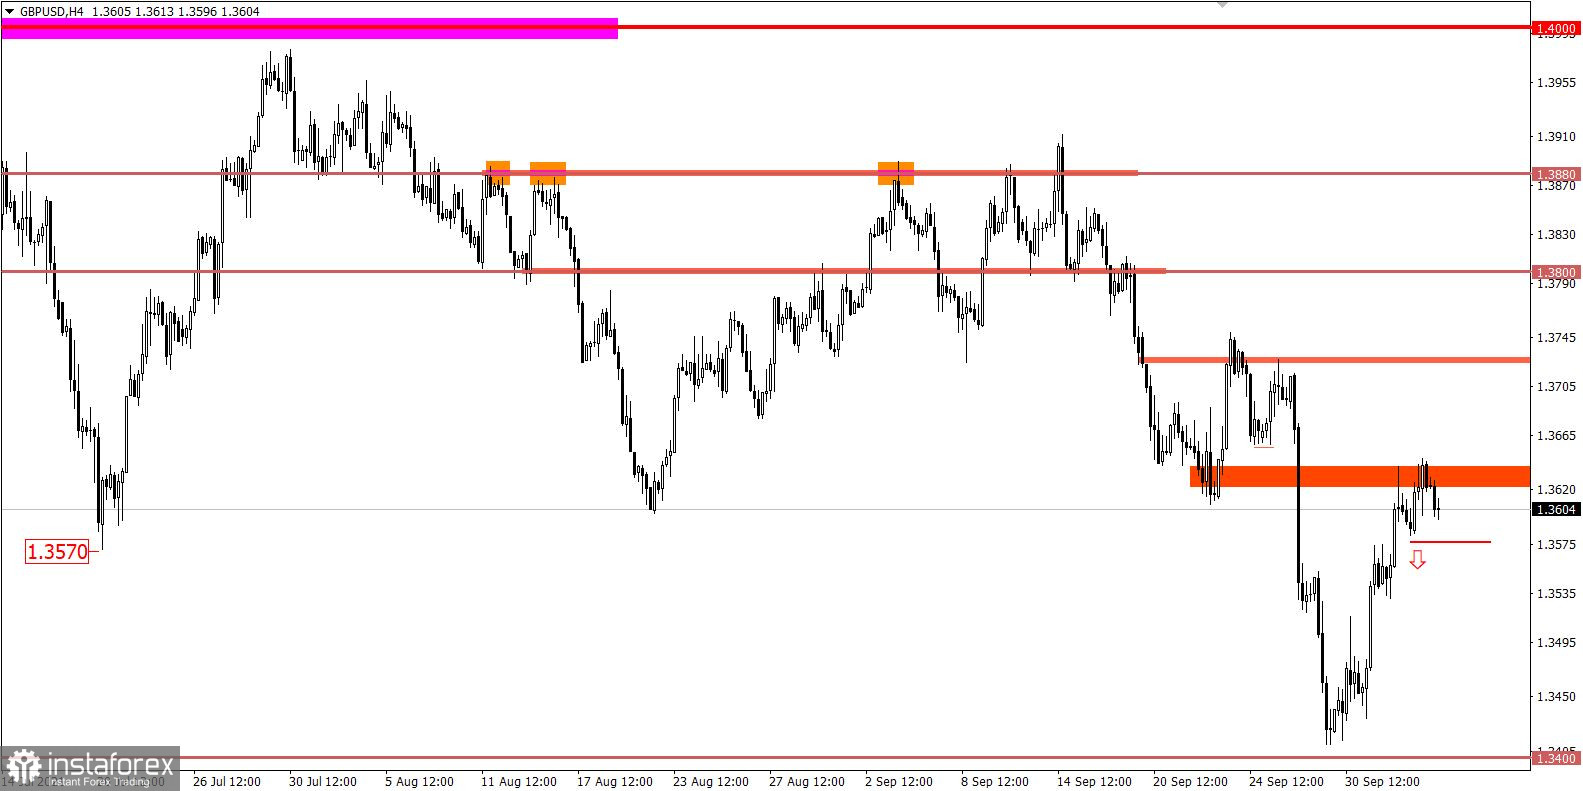
The GBP/USD pair encountered the resistance area of 1.3620/1.3650 on the way to correction, where there was a reduction in the volume of long positions. This led to a slowdown in the upward movement and a price rebound.
Despite a fairly large-scale corrective move, the market is still dominated by downward interest. This is indicated by a number of technical facts: prolongation of the downward cycle from the beginning of June, keeping the price at the levels of December 2020.
Long positions or Long means buying positions in anticipation of an increase in the value of the asset.
* The resistance level is the so-called price coordinate, from which the quote can slow down or stop the upward course. The principle of constructing this level is to reduce the price stop points on the history of the chart, where a price reversal in the market has already taken place.
* A change of trading interests is when there is a change of direction in the market from ascending to descending or from descending to ascending.
October 6 economic calendar:
Europe's retail sales data will be published today at 9:00 Universal time. Its growth rate may slow down from 3.1% to 0.4%. Such a significant drop in sales, paired with rising inflation in the EU, is not considered the best signal for the euro.
The ADP report will be published at 12:15 Universal time, where the US employment is forecasted to rise by 350 thousand in September, which is considered a fairly good value. Therefore, the US dollar may well receive support.
* The volume of retail sales is one of the main economic indicators, which is an indicator of the change in sales volume in the context of retail trade. In simple words, this indicator reflects the purchasing power of the population.
* The employment report from ADP shows the change in the number of workers in the United States. The growth of the indicator has a positive effect on the unemployment rate in the country, as well as on consumer activity, which in turn, has an impact on economic growth.
Trading plan for EUR/USD on October 6:
The lack of a major correction indicates the prevailing downward interest, which does not provide an opportunity to increase the volume of long positions. It can be assumed that market participants will approach the level of 1.1562 again soon with the intention of breaking it.
The main sell signal of the euro is if the price is kept below the level of 1.1550. This will indicate a prolongation of the downward cycle towards the range of 1.1500-1.1420.
Trading plan for GBP/USD on October 6:
The resistance area of 1.3620/1.3650 continues to put pressure on buyers, which may be the completion stage of the corrective move. A confirmation of this signal is accompanied by the price holding below the level of 1.3580. In this case, sellers will have the opportunity to expand the quote towards the pivot point of 1.3400.
An alternative scenario for the development of the market considers the prolongation of the corrective movement if the price is kept above the level of 1.3655. In this scenario, the movement towards the level of 1.3700 is not excluded.
What is reflected in the trading charts?
A candlestick chart view is graphical rectangles of white and black light, with sticks on top and bottom. When analyzing each candle in detail, you will see its characteristics of a relative period: the opening price, closing price, and maximum and minimum prices.
Horizontal levels are price coordinates, relative to which a stop or a price reversal may occur. These levels are called support and resistance in the market.
Circles and rectangles are highlighted examples where the price of the story unfolded. This color selection indicates horizontal lines that may put pressure on the quote in the future.
The up/down arrows are the reference points of the possible price direction in the future.
Golden Rule: It is necessary to figure out what you are dealing with before starting to trade with real money. Learning to trade is so important for a novice trader because the market is constantly dynamic and it is important to understand what is happening.