يحتوي هذا القسم على أهم المعلومات حول التداول مع إنستافوركس. نحن نقدم كلاً من التحليل من كبار الخبراء للمتداولين ذوي الخبرة والمقالات حول ظروف التداول للمبتدئين. ستساعد خدماتنا في زيادة أرباحك المحتملة.
انظر أيضا
هذا القسم مصمم لأولئك الذين بدأوا للتو رحلة تداولهم. ستلبي المواد التعليمية والتحليلية المقدمة من قبل إنستافوركس احتياجاتك التدريبية. ستجعل توصيات خبرائنا خطواتك الأولى نحو نجاح التداول بسيطة وواضحة.
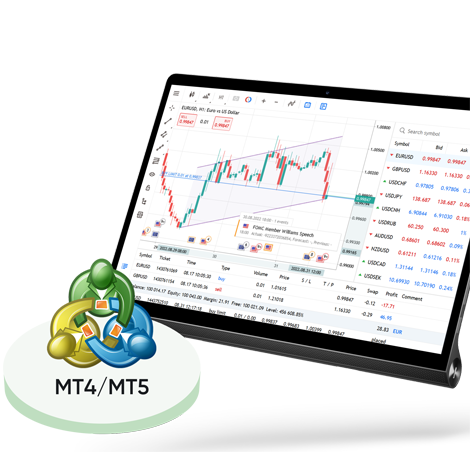
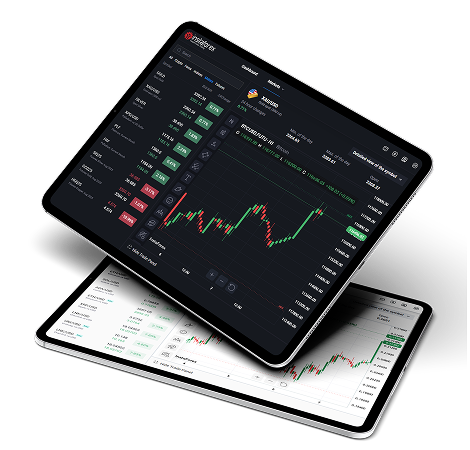
تعد خدمات إنستافوركس المبتكرة عنصرًا أساسيًا في الاستثمار الإنتاجي. نحن نسعى جاهدين لتزويد عملائنا بقدرات تقنية متقدمة وجعل روتين التداول الخاص بهم مريحًا حيث إننا معترف بنا كأفضل وسيط في هذا الصدد.
الشراكة مع إنستافوركس مفيدة ورفيعة المستوى. انضم إلى برامج الشراكة الخاصة بنا واحصل على مكافآت وعمولات وفرصة للسفر مع فريق العلامة التجارية المشهورة عالميًا.
هذا القسم يحتوي على العروض الأكثر ربحًا من إنستافوركس. احصل على البونصات عند تعبئة الحساب ، وتنافس مع المتداولين الآخرين ، واحصل على جوائز حقيقية حتى عند التداول في حساب تجريبي.
العطلات مع إنستافوركس ليست ممتعة فقط ولكنها مفيدة أيضًا. نحن نقدم بوابة شاملة والعديد من المنتديات ومدونات الشركات ، حيث يمكن للمتداولين تبادل الخبرات والاندماج بنجاح في مجتمع الفوركس.
إنستافوركس هي علامة تجارية دولية تم إنشاؤها في عام 2007. تقدم الشركة الخدمات في مجال تداول الفوركس عبر الإنترنت وهي معترف بها كواحدة من شركات الوساطة الرائدة في العالم. لقد فزنا بثقة أكثر من 7,000,000 من متداولي التجزئة الذين أعربوا بالفعل عن تقديرهم لموثوقيتنا وتركيزنا على الابتكارات.