empty
02.02.2022 08:22 AM
EUR/USD: plan for the European session on February 2. COT reports. Pressure on the euro may return. Need to protect 1.1255

To open long positions on EUR/USD, you need:

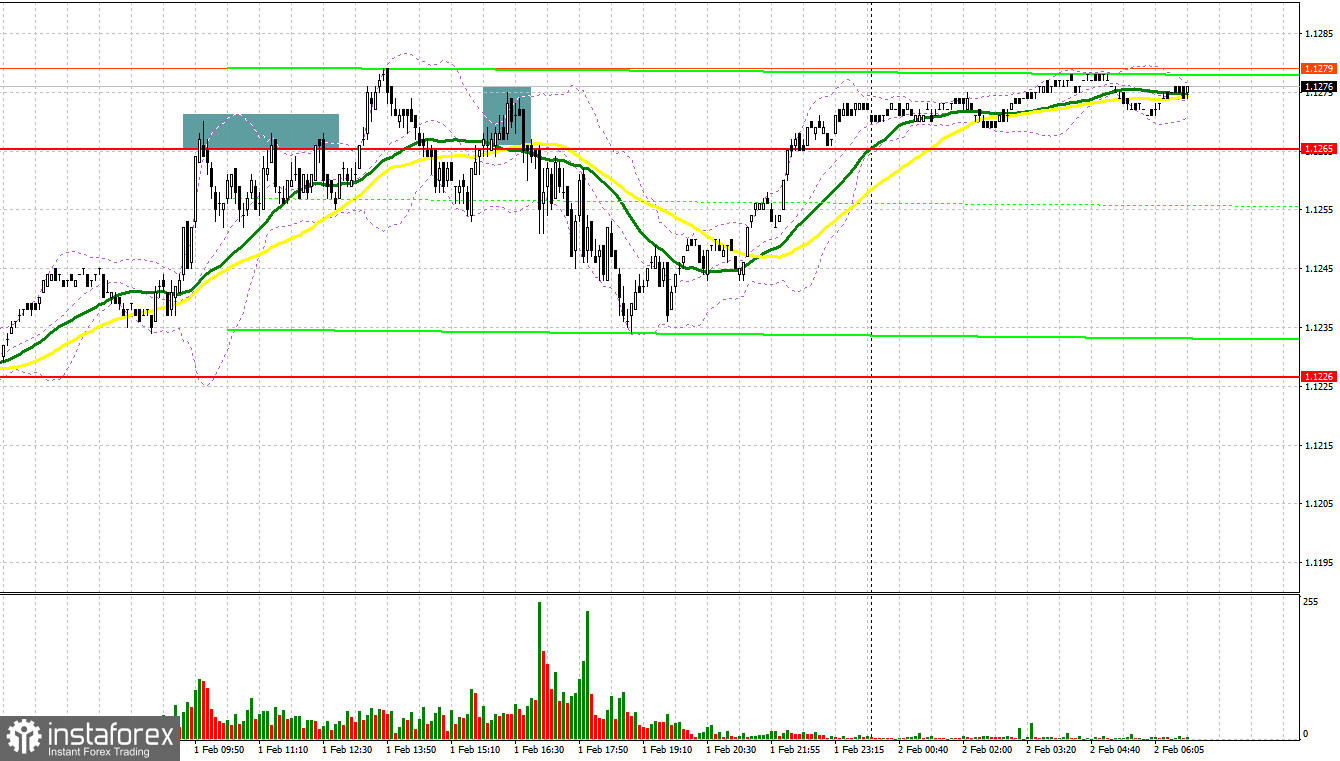
Yesterday, a huge number of signals for selling the euro were formed, but they were all realized only in the afternoon. Let's look at the 5-minute chart and figure out what happened. In my morning forecast, I paid attention to the level of 1.1265 and advised you to make decisions on entering the market. The bulls' low activity near this range in the first half of the day made it possible for bears to form several good entry points into short positions. However, the pair sank well in the afternoon after the report on manufacturing activity in the United States was released, which made it possible to take about 30 points of profit from the market.

This image is no longer relevant

Today, the focus will be on important data on the consumer price index of the eurozone countries. It is expected that inflationary pressure in the eurozone will decrease slightly, which may negatively affect the dynamics of the pair's growth in the first half of the day.

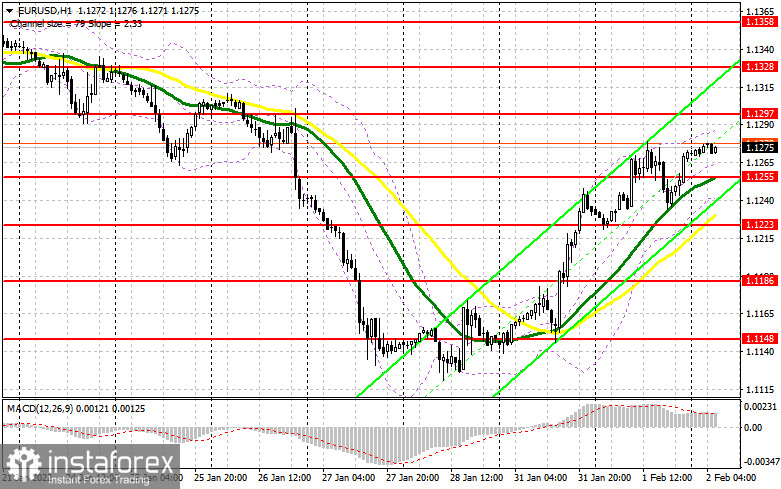
An important task is to protect the support of 1.1255, where the moving averages are, while playing on their side. Given that the European Central Bank will hold a meeting tomorrow, it is quite possible that demand for the euro will return from this level. Forming a false breakout at 1.1255 creates an excellent entry point into long positions in continuation of the upward correction with the gradual formation of a new bullish trend. An equally important task for euro bulls is to control the resistance of 1.1297. A breakthrough and a reverse test from the top down of this range, together with strong inflation data in the eurozone, will lead to another buy signal and open up the possibility of recovery to the area: 1.1328. A more distant target will be the level of 1.1358, but it is possible to count on updating this range only with a very strong increase in inflation and increased expectations of a more aggressive policy on the part of the ECB. I recommend taking profits there.

If the pair declines during the European session and there is no bull activity at 1.1255, the pressure on the euro may seriously increase. In this case, it is best to postpone long positions to a low of 1.1223. However, I advise you to open long positions there when forming a false breakout. It is possible to buy the euro immediately for a rebound from the level of 1.1186 with the goal of an upward correction of 20-25 points within the day. Much will depend on the release of data on the American labor market. A report from ADP will be published today.

To open short positions on EUR/USD, you need:

Bears remain on the sidelines, focusing on tomorrow's ECB meeting. To stop the upward correction, you need to try very hard not to miss the 1.1297 level today. The formation of a bullish divergence on the MACD indicator will be an additional signal to open short positions in order to pull EUR/USD to the area of 1.1255.

This image is no longer relevant

A breakthrough in this area will depend entirely on the market's reaction to the inflation data for the eurozone. If the growth slows down, we will see a breakthrough of 1.1255. A reverse test from the bottom up of this range will provide another signal to open short positions with the prospect of falling to large lows: 1.1223 and 1.1186. A more distant target will be the 1.1148 area, but it will be available only in case we receive very strong data on the American economy. I recommend taking profits there.

In case the euro grows and the bears are not active at 1.1297, it is best not to rush with short positions. The optimal scenario will be short positions when forming a false breakout in the area of 1.1328. You can sell EUR/USD immediately on a rebound from 1.1358, or even higher - around 1.1390 with the goal of a downward correction of 15-20 points.

I recommend for review:

The Commitment of Traders (COT) report for January 25 showed that long positions had increased while short ones decreased, which led to a further increase in the positive delta. The demand for risky assets will continue to persist, because even after the results of the Federal Reserve meeting, where there were clear hints of an increase in interest rates in March 2022, the market did not react with a serious drop in risky assets, and the changing balance of power speaks for itself. This week, everyone is waiting for the results of the European Central Bank meeting, at which a decision on monetary policy will be made. Some traders expect that the central bank may resort to more aggressive statements aimed at policy changes in the near future and to abandon measures to support the economy due to the threat of high inflation. However, most analysts do not expect changes from the ECB. Much will depend on whether the ECB agrees to fully complete its emergency bond purchase program as early as March this year, or not. If so, the demand for the euro will only increase, since such actions will sooner or later lead to an increase in interest rates in the eurozone. The COT report indicates that long non-commercial positions rose from the level of 211,901 to the level of 213,408, while short non-commercial positions fell from the level of 187,317 to the level of 181,848. This suggests that traders continue to build up long positions on the euro in hopes of building an upward trend. At the end of the week, the total non-commercial net position remained positive and amounted to 31,569 against 24,584. But the weekly closing price decreased and amounted to 1.1323 against 1.1410 a week earlier.

Indicator signals:

Trading is above the 30 and 50 daily moving averages, which indicates an upward correction for the pair.

Moving averages

Note: The period and prices of moving averages are considered by the author on the H1 hourly chart and differs from the general definition of the classic daily moving averages on the daily D1 chart.

Bollinger Bands

Crossing the lower border of the indicator in the area of 1.1245 will lead to a fall in the euro. Crossing the upper border of the indicator in the area of 1.1280 will lead to an increase in the euro.

Description of indicators

  • Moving average (moving average, determines the current trend by smoothing out volatility and noise). Period 50. It is marked in yellow on the chart.
  • Moving average (moving average, determines the current trend by smoothing out volatility and noise). Period 30. It is marked in green on the chart.
  • MACD indicator (Moving Average Convergence/Divergence — convergence/divergence of moving averages) Quick EMA period 12. Slow EMA period to 26. SMA period 9
  • Bollinger Bands (Bollinger Bands). Period 20
  • Non-commercial speculative traders, such as individual traders, hedge funds, and large institutions that use the futures market for speculative purposes and meet certain requirements.
  • Long non-commercial positions represent the total long open position of non-commercial traders.
  • Short non-commercial positions represent the total short open position of non-commercial traders.
  • Total non-commercial net position is the difference between short and long positions of non-commercial traders.
เลือกช่วงเวลา
5
นาที
15
นาที
30
นาที
1
ชั่วโมง
4
ชั่วโมง
1
วัน
1
สัปดาห์
รับผลกำไรจากการเปลี่ยนแปลงอัตราสกุลเงินดิจิทัลกับ InstaForex.
ดาวน์โหลด MetaTrader 4 และเปิดการซื้อขายครั้งแรกของคุณ.
ข่าวสารตลาดสหรัฐอเมริกาประจำวันที่ 2 พฤษภาคม ดัชนีหุ้นสหรัฐยังคงเพิ่มขึ้นอย่างต่อเนื่อง แม้ว่าจะมีความไม่แน่นอนทางเศรษฐกิจ นักลงทุนมองในแง่ดีด้วยความคาดหวังต่อความก้าวหน้าในการเจรจาการค้าระหว่างสหรัฐและจีน อย่างไรก็ตาม ความเสี่ยงทางเศรษฐกิจที่ยังคงมีอยู่อาจจำกัดการปรับตัวขึ้นของตลาดในปัจจุบัน แม้ผลกระทบของสงครามการค้าจะยังคงมีอยู่ ผู้เข้าร่วมตลาดก็ยังคาดหวังว่าความตึงเครียดจะผ่อนคลายลงและกิจกรรมทางธุรกิจจะกลับมาฟื้นตัวในไม่ช้า ติดตามรายละเอียดเพิ่มเติมได้ตามลิงก์ ตลาดหุ้นได้รับการสนับสนุนจากผลประกอบการที่แข็งแกร่งของบริษัทต่างๆ และข่าวบวกเกี่ยวกับข้อตกลงทางการค้า ซึ่งช่วยยกดัชนีต่างๆ เช่น S&P
USD/JPY: เคล็ดลับการเทรดง่ายๆ สำหรับนักเทรดมือใหม่ในวันที่ 2 พฤษภาคม (เซสชั่นสหรัฐ) การวิเคราะห์การค้าและคำแนะนำสำหรับเงินเยนญี่ปุ่น การทดสอบที่ระดับ 145.05 เกิดขึ้นเมื่อเกิดเหตุการณ์ที่ตัวบ่งชี้ MACD ได้เคลื่อนไหวได้ถึงจุดที่ต่ำกว่าเส้นศูนย์อย่างมาก จึงทำให้ศักยภาพการลงของดอลลาร์จำกัด ด้วยเหตุนี้ผมจึงไม่ได้ขายดอลลาร์ และพลาดการเคลื่อนไหวลงเพียงเล็กน้อย การเปิดเผยข้อมูลเศรษฐกิจที่สำคัญของสหรัฐฯ เกี่ยวกับการจ้างงานนอกภาคเกษตรและอัตราการว่างงานจะเกิดขึ้นในไม่ช้านี้ เสมอไปที่นักลงทุนและผู้เชี่ยวชาญมักจะจับตาดูตัวชี้วัดเหล่านี้อย่างใกล้ชิด เพราะมันจะบอกถึงสถานะเศรษฐกิจของสหรัฐฯ และทิศทางถัดไปของนโยบายการเงินของธนาคารกลางสหรัฐ การเปลี่ยนแปลงในจำนวนการจ้างงานนอกภาคเกษตรที่เป็นลบอาจบ่งชี้ถึงการพัฒนาทางเศรษฐกิจที่ชะลอตัว
  • Grand Choice
    Contest by
    InstaForex
    InstaForex always strives to help you
    fulfill your biggest dreams.
    เข้าร่วมการแข่งขัน


บทความแนะนำ

GBP/USD: แผนการเทรดสำหรับช่วงตลาดสหรัฐฯ ในวันที่ 2 พฤษภาคม (รีวิวการซื้อขายในช่วงเช้า)

ในคำพยากรณ์ช่วงเช้าของฉัน ฉันมุ่งเน้นไปที่ระดับ 1.3313 และวางแผนที่จะทำการตัดสินใจทางการค้าที่จุดนั้น เรามาดูที่กราฟ 5 นาทีและวิเคราะห์สิ่งที่เกิดขึ้น การเพิ่มขึ้นตามด้วยการทะลุระดับที่ผิดพลาดรอบ ๆ 1.3313 เป็นโอกาสที่ดีสำหรับการเปิดสถานะขาย ส่งผลให้เกิดการลดลงมากกว่า 40 จุด มุมมองทางเทคนิคถูกปรับแก้สำหรับช่วงครึ่งหลังของวัน

Miroslaw Bawulski 12:14 2025-05-02 UTC+2

EUR/USD: แผนการเทรดสำหรับช่วงการซื้อขายในสหรัฐอเมริกาในวันที่ 2 พฤษภาคม (บทวิเคราะห์การเทรดในช่วงเช้า)

ในคำทำนายตอนเช้าของฉัน ฉันได้เน้นไปที่ระดับ 1.1337 และวางแผนตัดสินใจในการเข้าสู่ตลาดตามระดับนั้น มาดูกราฟ 5 นาทีและวิเคราะห์สิ่งที่เกิดขึ้น การเพิ่มขึ้นและการสร้างจุดเบรกหลอกบริเวณ 1.1337 ทำให้เป็นจุดเข้าซื้อขายที่ดีสำหรับการขายยูโร ส่งผลให้มีการลดลงเพียง 20 จุดของคู่เงินก่อนที่แรงกดดันจะผ่อนคลายลง ภาพทางเทคนิคได้ถูกปรับปรุงใหม่สำหรับช่วงครึ่งหลังของวัน ครึ่งหลังของวันมีความสำคัญสำหรับดอลลาร์และอาจส่งผลต่อการตัดสินใจนโยบายการเงินของ

Miroslaw Bawulski 12:06 2025-05-02 UTC+2

GBP/USD: แผนการซื้อขายในช่วงตลาดยุโรปวันที่ 2 พฤษภาคม รายงาน Commitment of Traders (COT) (การตรวจสอบการซื้อขาย) ปอนด์อยู่ในสถานการณ์ที่ยากลำบาก

จุดเข้าไปในตลาดหลายจุดได้ถูกสร้างขึ้นเมื่อวานนี้ ลองมาดูกราฟ 5 นาทีและวิเคราะห์เหตุการณ์ที่เกิดขึ้น ฉันได้เน้นระดับ 1.3282 ในการพยากรณ์ช่วงเช้าและวางแผนที่จะตัดสินใจในการซื้อขายจากพื้นที่นั้น การลดลงและการสร้างรูปแบบการเบรกที่ผิดพลาดรอบๆ ระดับ 1.3282 ได้สร้างจุดเข้าซื้อที่ดีสำหรับตำแหน่งซื้อ ซึ่งนำไปสู่การขึ้นอย่างรวดเร็วไปยังระดับเป้าหมายที่ 1.3325 ในช่วงครึ่งหลังของวัน การป้องกันแนวรับใหม่ที่

Miroslaw Bawulski 07:53 2025-05-02 UTC+2

EUR/USD: แผนการเทรดสำหรับเซสชั่นยุโรปวันที่ 2 พฤษภาคม รายงานความมุ่งมั่นของผู้ค้า (COT) (ทบทวนการค้า) ดอลลาร์ตอบสนองต่อข้อมูลเชิงบวกใดๆ

เมื่อวานนี้มีจุดเข้าสู่ตลาดหลายจุดเกิดขึ้น ลองมาดูกราฟ 5 นาทีและวิเคราะห์สิ่งที่เกิดขึ้นกัน ในการคาดการณ์ตอนเช้า ฉันได้เน้นระดับ 1.1320 ว่าเป็นจุดสำคัญสำหรับการตัดสินใจทางการค้า การลดลงและการทะลุที่ผิดพลาดรอบๆ ระดับ 1.1320 ทำให้มีโอกาสในการเข้าซื้อยูโรที่ดี ซึ่งนำไปสู่กำไร 20 พิพ

Miroslaw Bawulski 07:53 2025-05-02 UTC+2

เทคนิคการเทรดคู่เงิน GBP/USD วันที่ 2 พฤษภาคม: เคล็ดลับง่ายๆ และการวิเคราะห์การซื้อขายสำหรับมือใหม่

เมื่อวันพฤหัสบดี คู่สกุลเงิน GBP/USD ยังคงเคลื่อนไหวลง แม้ว่าภาพรวมยังคงคล้ายกับการเคลื่อนตัวในช่วงแนวนอน ปอนด์อังกฤษยังคงมีแนวโน้มขาขึ้น แต่การเติบโตล่าสุดอ่อนแอลงมากเมื่อเทียบกับช่วงก่อนหน้า เช่นเดียวกับยูโร ไม่มีเหตุผลพื้นฐานที่อยู่เบื้องหลังการขึ้นของดอลล่าห์ที่เกิดขึ้นตลอดสามวันของสัปดาห์นี้ อย่างที่จำได้ว่าหมายเหตุเมื่อวันพุธ รายงาน GDP ของสหรัฐฯ ประจำ

Paolo Greco 06:31 2025-05-02 UTC+2

วิธีการเทรดคู่เงิน EUR/USD ในวันที่ 2 พฤษภาคม? เคล็ดลับง่าย ๆ และการวิเคราะห์การเทรดสำหรับผู้เริ่มต้น

ในวันพฤหัสบดี คู่สกุลเงิน EUR/USD ยังคงเคลื่อนไหวลงต่อเนื่องและมาถึงระดับ 1.1275 ณ สิ้นวัน ซึ่งถือเป็นขอบล่างของช่องทางการซื้อขายที่คู่เงินนี้อยู่ในภาวะคลาดเคลื่อนในช่วงเวลากว่าสามสัปดาห์ที่ผ่านมา เราตั้งใจขยับกราฟออกเพื่อแสดงช่วงนี้เป็นพิเศษ ควรสังเกตว่า การเบรกเอาท์สั้นๆ เหนือช่องทางที่เกิดขึ้นในสัปดาห์ที่ผ่านมาถือว่าเป็นปรากฏการณ์ที่ผิดปกติและไม่ได้นำมารวมในการวิเคราะห์นี้ ดังนั้น การเพิ่มขึ้นของดอลลาร์ในสามวันนั้นดูไร้เหตุผล Donald

Paolo Greco 06:31 2025-05-02 UTC+2

คำแนะนำและการวิเคราะห์การซื้อขายสำหรับ GBP/USD วันที่ 2 พฤษภาคม: ดอลลาร์เผชิญบททดสอบสำคัญ

คู่สกุลเงิน GBP/USD ยังคงมีการปรับตัวลงต่อเนื่องหลังจากที่ขึ้นในวันจันทร์ แม้ว่าจะมีแนวโน้มกว้างขวางที่กำลังขาขึ้น ไม่มีเหตุผลใดที่คาดว่าจะเห็นพฤติกรรมต่อที่เกิดขึ้นในวันจันทร์, อังคาร, พุธ, และพฤหัสบดี ดังนั้น เราจึงย้ำว่า ตลาดเคลื่อนตัวตามกฎเกณฑ์ของมันเอง, ความคาดหวัง, และความรู้สึก ตัวอย่างเช่น จะอธิบายการขึ้นของดอลลาร์สามวันยังไงดี

Paolo Greco 03:47 2025-05-02 UTC+2

คำแนะนำการซื้อขายและการวิเคราะห์สำหรับ EUR/USD วันที่ 2 พฤษภาคม: ดอลลาร์แข็งค่าเป็นวันที่สามติดต่อกัน

คู่สกุลเงิน EUR/USD ยังคงเคลื่อนไหวเพิ่มขึ้นอย่างช้าๆ ในวันพฤหัสบดี การเพิ่มขึ้นของดอลลาร์สหรัฐในขณะนี้ดูแปลก แต่พฤติกรรมราคาที่แปลกประหลาดได้กลายเป็นสิ่งปกติในช่วงหลายเดือนที่ผ่านมา ลองย้อนกลับไปดู: ตลาดยังคงเมินเฉยต่อบริบททางเศรษฐกิจมหภาคอย่างสิ้นเชิง ในวันจันทร์ ไม่มีข่าวอะไร แต่ดอลลาร์ร่วงลงอย่างรวดเร็ว ในวันอังคาร รายงาน JOLTS ของสหรัฐอ่อนแอ

Paolo Greco 03:47 2025-05-02 UTC+2

GBP/USD: แผนการเทรดในช่วงตลาดสหรัฐฯ วันที่ 1 พฤษภาคม (รีวิวการเทรดช่วงเช้า)

ในบทวิเคราะห์ตอนเช้าของฉัน ฉันเน้นที่ระดับ 1.3282 และวางแผนการตัดสินใจเข้าสถานะตามระดับนี้ มาดูกราฟ 5 นาทีและดูว่าเกิดอะไรขึ้น การลดลงตามมาด้วยการเบรคเอาท์แบบเท็จที่ระดับ 1.3282 สร้างจุดเข้าซื้อที่ดีสำหรับการเปิดสถานะซื้อ ส่งผลให้เกิดการพุ่งขึ้นอย่างรวดเร็วไปยังระดับเป้าหมายที่ 1.3325 ภาพทางเทคนิคได้รับการปรับแก้สำหรับช่วงครึ่งหลังของวัน วิธีการเปิดตำแหน่งซื้อ (Long

Miroslaw Bawulski 18:42 2025-05-01 UTC+2

EUR/USD: แผนการซื้อขายสำหรับการซื้อขายในช่วงสหรัฐฯ วันที่ 1 พฤษภาคม (การทบทวนการซื้อขายช่วงเช้า)

ในคำทำนายตอนเช้าของฉัน ฉันมุ่งเน้นที่ระดับ 1.1320 และวางแผนที่จะตัดสินใจเข้าสู่ตลาดโดยอิงจากระดับนี้ มาดูกันที่กราฟ 5 นาทีว่าเกิดอะไรขึ้น มีการลดลงและตามมาด้วยการฝ่าเพียมของระดับ 1.1320 ซึ่งนำไปสู่จุดเข้าซื้อยูโรที่ดี ส่งผลให้ราคาเพิ่มขึ้น 20 จุดในคู่สกุลเงิน รูปภาพทางเทคนิคถูกแก้ไขใหม่สำหรับช่วงครึ่งหลังของวัน วิธีการเปิดตำแหน่งยาวบน

Miroslaw Bawulski 18:38 2025-05-01 UTC+2
หากไม่สะดวกคุยในตอนนี้
ระบุคำถามไว้ได้ใน แชท.
Widget callback
 

Dear visitor,

Your IP address shows that you are currently located in the USA. If you are a resident of the United States, you are prohibited from using the services of InstaFintech Group including online trading, online transfers, deposit/withdrawal of funds, etc.

If you think you are seeing this message by mistake and your location is not the US, kindly proceed to the website. Otherwise, you must leave the website in order to comply with government restrictions.

Why does your IP address show your location as the USA?

  • - you are using a VPN provided by a hosting company based in the United States;
  • - your IP does not have proper WHOIS records;
  • - an error occurred in the WHOIS geolocation database.

Please confirm whether you are a US resident or not by clicking the relevant button below. If you choose the wrong option, being a US resident, you will not be able to open an account with InstaForex anyway.

We are sorry for any inconvenience caused by this message.