Long positions on EUR/USD:
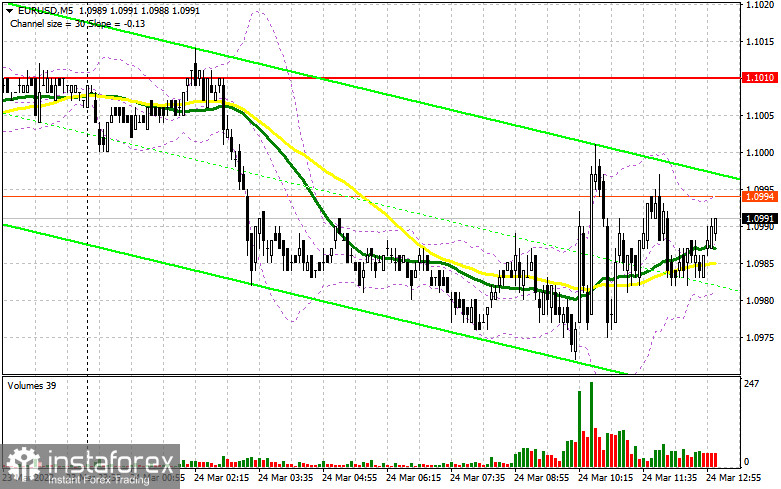
In my forecast this morning, I drew your attention to several levels and recommended entering the market from them. Let's have a look at the 5-minute chart and analyze what happened. Very low volatility in the first half of the day, compared to the one that has been observed recently, did not allow the price to test the levels I have outlined. Therefore, there were no signals for entering the market. It seems that the situation in the second half of the day is unlikely to change much. Amid the Fed's actions, one can expect more activity from the US dollar buyers. Technically, nothing has changed, including the strategy.

There are no speeches of the Fed representatives or macroeconomic data releases on the US economy in the afternoon, which is likely to keep the volatility within the sideways channel between 1.0965 and 1.1010. I hope the pair will test these levels. The sellers still have a slight advantage in the market, as the pair is trading near the lower boundary of the wider sideways channel of 1.0965-1.1049. That is the reason why bulls have to think hard about how to hold the price above support of 1.0965. Only a false breakout may form the first entry point into long positions. But in order to see a larger upside movement in EUR/USD, we need some more activity and a breakthrough of the middle of the sideways channel at 1.1010, which bulls failed to test yesterday. Taking into account that there are no positive changes in the geopolitical situation in the world, we can hardly expect a return of demand for risky assets. Only a breakthrough and a test of 1.1010, where the moving averages are siding with the sellers, may give a buy signal and open the way to the pair's recovery to the area of 1.1049, which represents the upper boundary of the sideways channel. The next target is located at the high of 1.1091, where traders may lock in profits. A breakthrough of this level is likely to cancel the bearish trend and trigger sellers' stop-loss orders, opening a direct way to the highs of 1.1136 and 1.1181. However, this scenario can be expected in the case there is good news on the improvement of the geopolitical situation in Ukraine. In case the pair falls and there is a lack of activity from bulls at 1.0965, it is better to postpone opening long positions. A false breakout of the low at 1.0928 would be the best buy scenario, however, it would be better to open long positions from 1.0891 to 1.0928, allowing an upward correction of 30-35 pips.
Short positions on EUR/USD:
Bears as well as bulls in the first half of the day were in some confusion and showed weak activity. During the US session, traders, counting on a more aggressive policy of the Federal Reserve, which will increase demand for the US dollar, may appear in the market. Bears should think further about how to hold the price below the resistance at 1.1010, as quite a lot depends on this level. That is where the moving averages are located, which are playing on the bulls' side, so a false breakout is likely to give a sell signal with the target at support of 1.0965. Bulls acted quite aggressively at this level yesterday, trying to preserve the uptrend. Taking into consideration the fact that important statistics are not released in the afternoon, we are unlikely to see a rapid breakthrough of this level. Only fixing below 1.0965 will trigger a number of speculative buyers' stop-losses, and a reverse test bottom/top of this level may give an additional signal for opening short positions, with the prospect of falling to the levels of 1.0928 and 1.0891. A new low at 1.0855, where traders can take profit, will be a more distant target. If the euro grows and bears show weak activity at 1.1010, bulls are likely to continue to accumulate long positions, counting on a return to the upper boundary of the sideways channel and resumption of the uptrend. In that case, it is better not to rush selling the pair. It is also better to open short positions after a false breakout around 1.1049. Selling the EUR/USD on the rebound is possible from 1.1091, or even higher near 1.1136, allowing a downward correction of 20-25 pips.

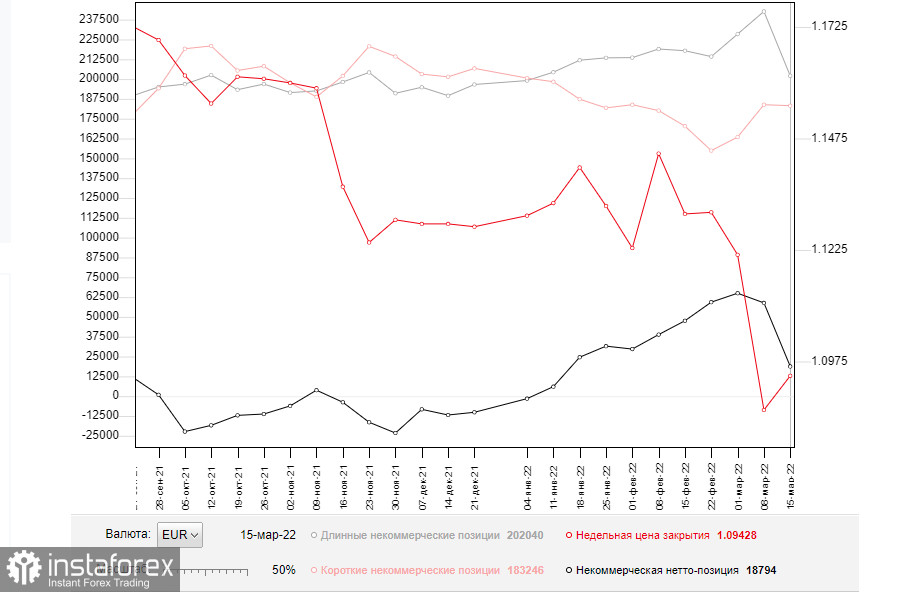
The COT (Commitment of Traders) report for March 15 showed a decrease in both long and short positions. However, if you look at the figures, you can see that short positions reduced just slightly unlike long ones, which dropped significantly. It is not surprising, against the background of the Russian military special operation in Ukraine. The Fed meeting was the central event of last week. As a result, the committee raised interest rates by 0.25%, which did not lead to serious changes in the market, as many had expected such decisions. Fed Chairman Jerome Powell took a wait-and-see approach during his speech and did not give any hints on a more aggressive policy, which triggered an accumulation of long positions in risky assets. However, at the beginning of this week, the Fed Chairman changed his approach saying in the interview that there was a high probability to increase the interest rate by 0,5% at the next FOMC meeting. This is a strong bullish signal for the US dollar which is likely to continue its growth against the euro. Recently, the European Central Bank also held a meeting, where President Christine Lagarde announced plans for a more aggressive tapering of economic support measures and interest rate hikes. It was good for the medium-term outlook of the European currency, which is already heavily oversold against the US dollar. The COT report showed that long non-commercials fell to 202,040 from 242,683, while short non-commercials declined to 183,246 from 183,839. At the end of the week, total non-commercial net positioning was down to 18,794 against 58,844. The weekly closing price rose slightly to 1.0942 from 1.0866.

Signals of indicators:
Moving Averages
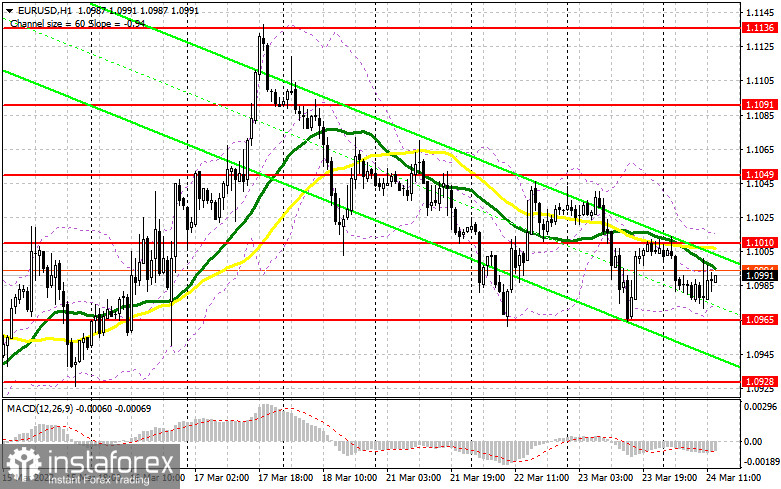
Trading is conducted below the 30- and 50-day moving averages, which indicates that bears are still controlling the market.
Note: The period and prices of moving averages are considered by the author on the one-hour chart that differs from the general definition of the classic daily moving averages on the daily chart.
Bollinger Bands
If the price rises, the upper limit of the indicator located at 1.1015 will act as a resistance level. A breakthrough of the lower boundary at 1.0970 is likely to cause a larger sell-off in the euro.
Description of indicators
- Moving average (moving average, determines the current trend by smoothing volatility and noise). The period is 50. It is marked in yellow on the chart.
- Moving average (moving average, determines the current trend by smoothing volatility and noise). The period is 30. It is marked in green on the graph.
- MACD indicator (Moving Average Convergence/Divergence - convergence/divergence of moving averages). A fast EMA period is 12. A slow EMA period is 26. The SMA period is 9.
- Bollinger Bands. The period is 20.
- Non-profit speculative traders are individual traders, hedge funds, and large institutions that use the futures market for speculative purposes and meet certain requirements.
- A long non-commercial position is a total long position opened by non-commercial traders.
- A short non-commercial position is a total short position opened by non-commercial traders.
- The total non-commercial net position is a difference between the short and long positions opened by non-commercial traders.