The EUR/USD pair plunged during the first trading day of the new week and the new year. This decline was hardly caused by PMI data in Germany or the EU, which also turned out to be stronger than expected. It appears that the single currency could no longer bear the weight placed upon it.
For the past one and a half months, we have repeatedly mentioned that the euro's growth leaves many questions unanswered. We already questioned how often the euro was appreciating. We repeatedly drew your attention to the fact that the market was interpreting all incoming information in a very one-sided manner. And we warned you that the longer the euro climbed, the stronger the subsequent decline would be.
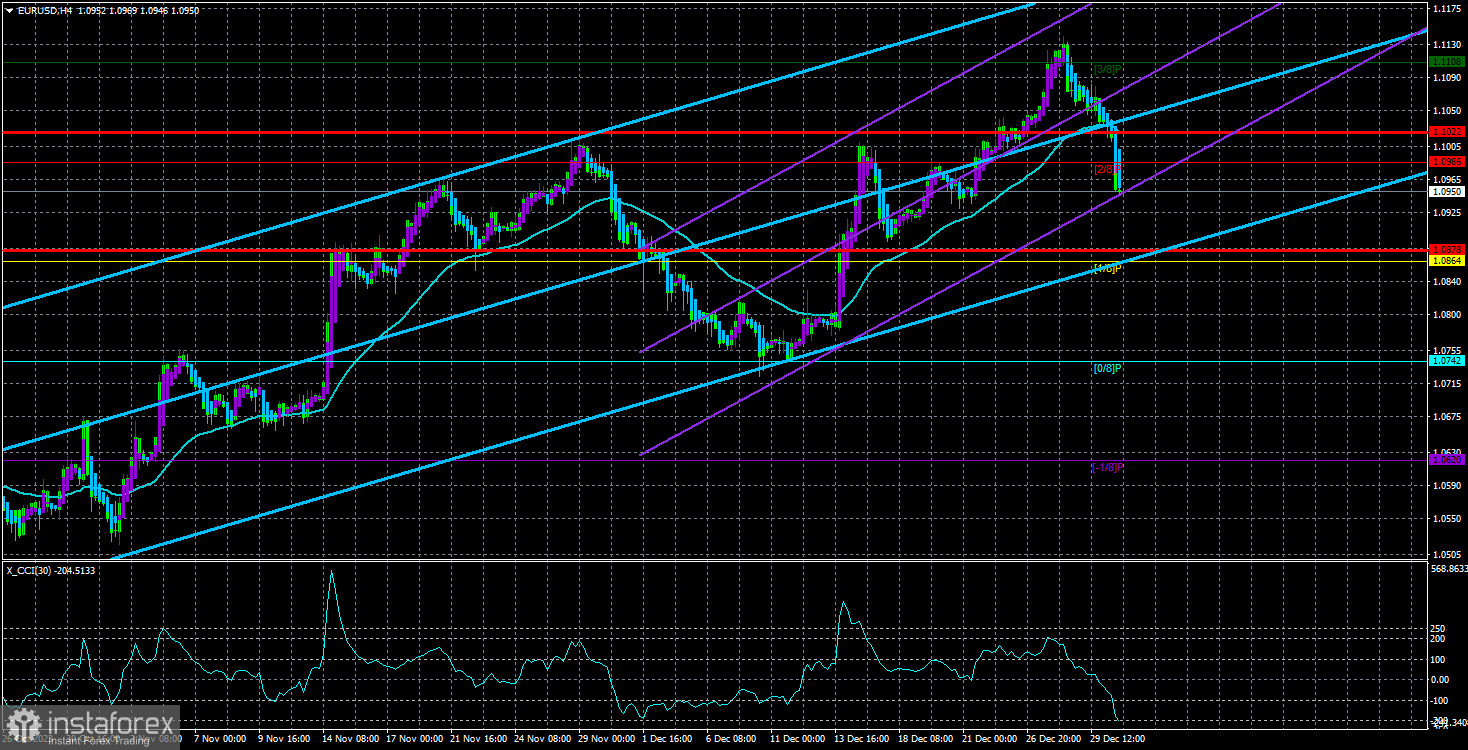
The CCI indicator entered the overbought area four times during the last three months of the uptrend. We believe that this is the first time it happened in many years. Entering an extreme area during a correction implies the proximity of restoring the main trend. And even if the trend doesn't resume, there should still be a significant correction to the downside.
However, the market simply refused to sell the euro and buy the dollar. The market convinced itself that the European Central Bank would start lowering rates much later than the Federal Reserve, and it didn't matter that the Fed's rate is currently higher and will remain so for a long time. It's a classic case of momentum-driven movement in the "bitcoin style." The currency is rising simply because it's being bought, not because there are concrete reasons for it.
Even during the New Year week, the euro managed to appreciate, despite the empty economic calendar. Thus, neither last week's movements nor yesterday's movement are in any way related to macroeconomics or fundamentals. These are purely technical movements, if one can put it that way.
Now, the pair is below the moving average line, indicating the first sign of a shift to the downtrend. According to the "Linear Regression Channel", we expect the price to fall, at least to the Murray level "0/8" - 1.0742, where the last local low is located. In the long term, we expect a much stronger fall, as we still do not understand what the euro's rise is based on.
Yes, for a couple of months, the market bought the euro for no reason, but this could not continue indefinitely! Everything that drove the euro to rise in November and December was a series of US reports that were not very strong, as well as resonating speeches by ECB President Christine Lagarde and Fed Chair Jerome Powell at the last central bank meetings in 2023.
But at the same time, the market somehow simply turned a blind eye to European data, which has not been pleasing for a year and a half, turned a blind eye to European inflation, which has already dropped to almost 2%, turned a blind eye to the fact that Lagarde has been silent about a rate cut in 2024, which does not mean that there will be no monetary easing. And the market worked out these factors, but even they had to stop their influence sooner or later. It seems that we are now at a turning point.
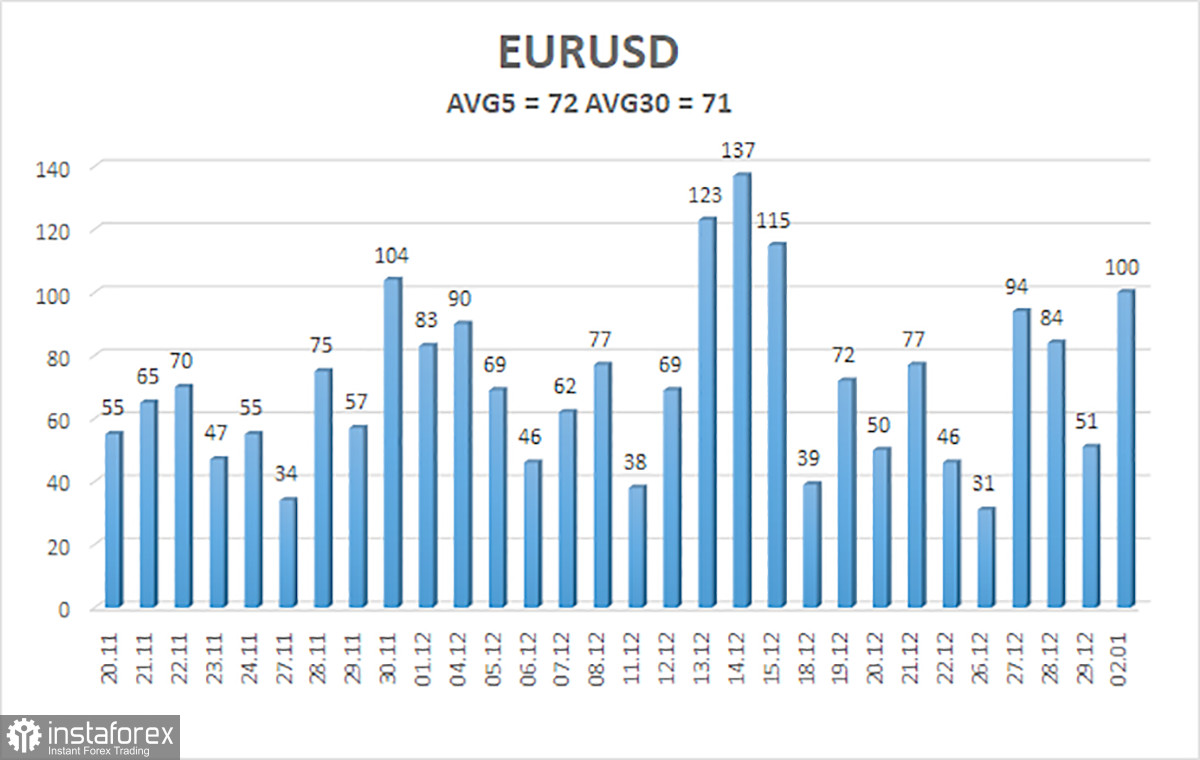
The average volatility of the EUR/USD pair over the last five trading days as of January 3rd is 72 pips and is characterized as "average." Therefore, we expect the pair to move between the levels of 1.0878 and 1.1022 on Wednesday. An upward reversal of the Heiken Ashi indicator may restore the upward movement.
The nearest support levels:
S1 – 1.0864
S2 – 1.0742
S3 – 1.0620
The nearest resistance levels:
R1 – 1.0986
R2 – 1.1108
R3 – 1.1230
Trading recommendations:
The EUR/USD pair has settled below the moving average line, so the downward movement may continue. The overbought condition of the CCI indicator has long indicated an excessively high cost of the euro, and now we have the first signal of a downward reversal. Therefore, we advise you to open short positions with targets at 1.0878 and 1.0864. We will consider new longs after the price closes back above the moving average with a target of 1.1108.
Description of the chart:
Linear Regression Channels: They help determine the current trend. If both are pointing in the same direction, it indicates a strong trend.
Moving Average Line (settings 20,0, smoothed): It identifies the short-term trend and the direction in which trading should currently be conducted.
Murray Levels: Target levels for movements and corrections.
Volatility levels (red lines): The probable price channel in which the pair will move over the next day, based on current volatility indicators.
CCI Indicator: Its entry into the overbought territory (above +250) or oversold territory (below -250) signals an approaching trend reversal in the opposite direction.