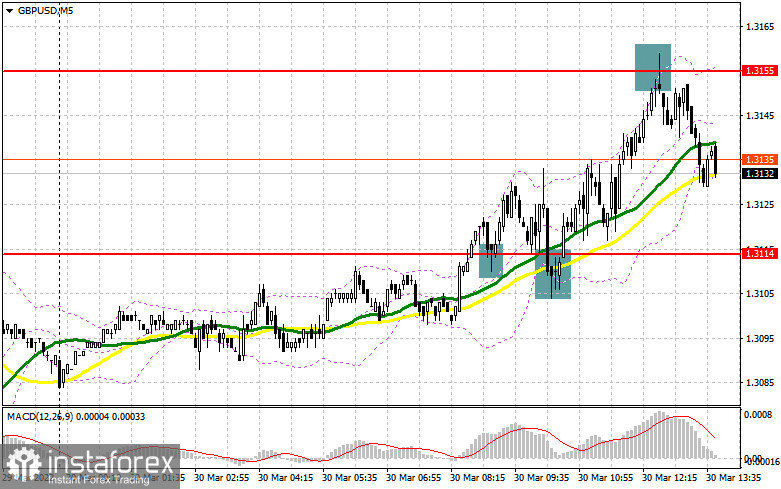
In the morning article, I highlighted the level of 1.3114 and recommended taking decisions with this level in focus. Now let's look at the 5-minute chart and try to figure out what actually happened. A breakout and consolidation above this level with a downward test gave a buy signal. Notably, there are several attempts to break above the indicated level. As a result, the pound/dollar pair reached a high of 1.3155. As a result, the pair gained about 40 pips. A false breakout at 1.3155 gave a sell signal. At the time of writing this article, the pair went down by about 25 pips. Judging by technical indicators, the trajectory has not changed significantly. However, there are new entry points that traders should pay attention to.
What is needed to open long positions on GDP/USD
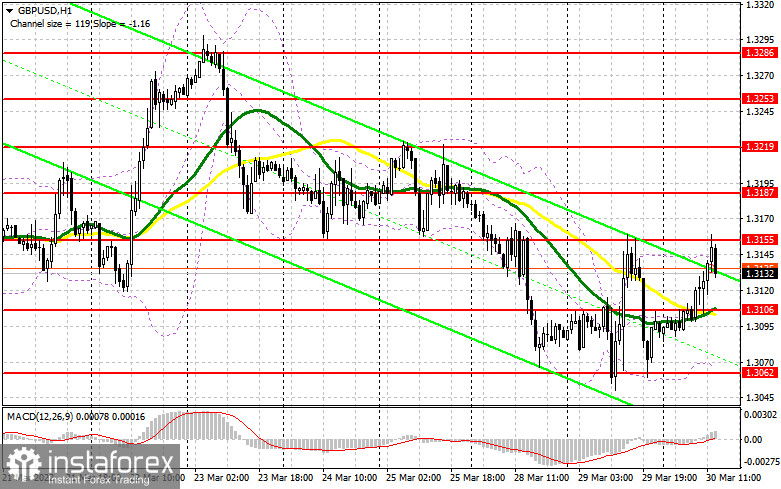
In the afternoon, the ADP report and GDP data for the fourth quarter of 2021 are on tap. The US dollar is likely to regain ground only if these reports are strong. If figures turn out to be worse than economists' forecasts, the pair may grow above 1.3155. For a continuation of the upward correction, the bulls need to take control of the current range. They failed to do so in the first half of the day. Only a breakout, consolidation, and a downward test of 1.3155 will give an additional buy signal. After that, the pair may approach 1.3187. Consolidation above this level will erase most of the bears' stop orders. The pound sterling may soar to 1.3219, where I recommend profit-taking. US macroeconomic data is downbeat will only fuel its growth. A breakout and a downward test of 1.3219 will provide a buy signal, boosting a rise in the pair to the highs: 1.3253 and 1.3289. If the pound/dollar pair declines during the American session, it is best to postpone long positions until the support level of 1.3106. At this level, the moving averages are passing in the positive zone. I would also advise opening long positions there only if a false breakout occurs. You can buy GBP/USD immediately on a rebound from 1.3062 or even a lower low of 1.3033, keeping in mind an intraday correction of 30-35 pips.
What is needed to open short positions on GDP/USD
The bears once again defended the level of 1.3155. As long as the pair is trading below this level, it is likely to remain in a wide sideways channel. It may also lead to a decline. In this case, the nearest target level will be 1.3106. New sell signals may appear only amid a breakout and an upward test of this level. Apart from that, strong data on the US labor market, GDP for the 4th quarter as well as hawkish statements by Fed policymakers will also contribute to the bearish sentiment. In this case, the pair may sink to the low of 1.3062. The support level of 1.3033 will be a more distant target level. If the pair breaks through 1.3155, there will be a drop in the stop orders. As a result, it may trigger a larger upward correction. The bears will need to protect 1.3187. The formation of a false breakout at this level will provide another entry point into short positions to slow down the rise of the pair. If there is no activity at 1.3187, bears may face serious problems. In this case, it is recommended to postpone short positions to 1.3219. It would also be wise to open short positions at that level in case of a false breakout. It is possible to open short positions immediately for a rebound from 1.3253 or even a higher high of 1.3286, keeping in mind an intraday downward correction of 20-25 pips.
COT report
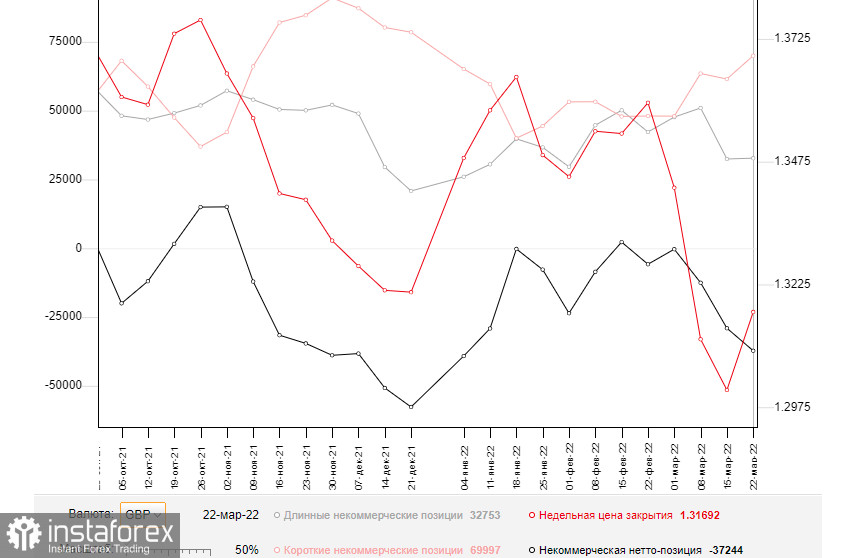
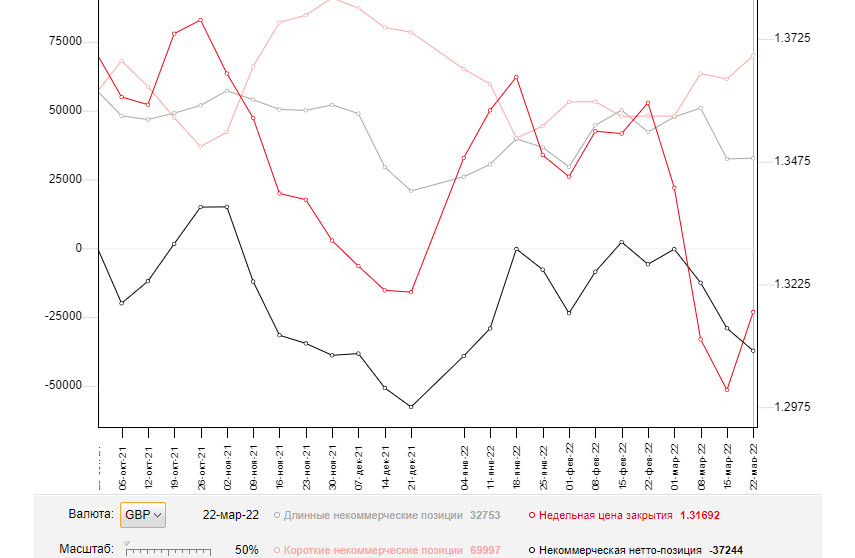
The COT reports (Commitment of Traders) for March 22 logged a sharp increase in short positions and only a slight rise in long ones. The pound sterling faced pressure after statements made by Fed policymakers last week. It is still unable to recover due to doldrums in the UK economy that put a strain on households. Experts warn that inflationary risks hinder a normal pace of economic development in the country. So, the situation may get even worse. Surging energy prices and the geopolitical situation in Ukraine, and the backlash of severe Western sanctions are harmful to the British economy. The BoE governor provided dovish comments this well. It triggered another sell-off of the pound sterling, which may continue due to the lack of positive fundamental factors. The only positive factor GBP bulls can rely on is progress in the Russia-Ukraine negotiations According to the COT report from March 22, the number of long non-commercial positions increased to 32,753 from 32,442. The number of short non-commercial positions jumped to 69,997 from 61,503. As a result, the negative delta of non-commercial net positions rose to -37,244 from -29.061. The weekly closing price climbed to 1.3169 versus 1.3010.
Signals of technical indicators
Moving averages
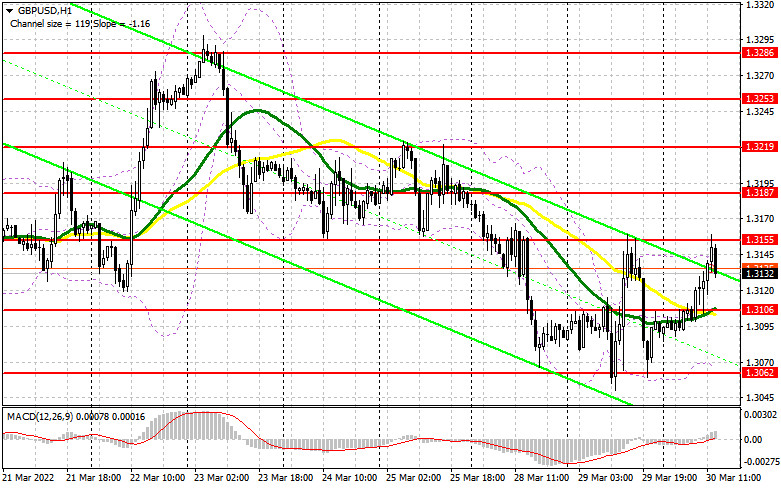
GBP/USD is trading above 30- and 50-period moving averages. It means that the bulls don't give up attempts to carry on with an upward movement.
Remark. The author is analyzing a period and prices of moving averages on the 1-hour chart. So, it differs from the common definition of classic daily moving averages on the daily chart.
Bollinger Bands
In case of a decline, 1.3065 will act as support.
A breakout of the upper border at about 1.1337 will trigger a new bullish wave of EUR. Alternatively, a breakout of the lower border at about 1.1305 will escalate pressure on EUR/USD.
Definitions of technical indicators
- Moving average recognizes an ongoing trend through leveling out volatility and market noise. A 50-period moving average is plotted yellow on the chart.
- Moving average identifies an ongoing trend through leveling out volatility and market noise. A 30-period moving average is displayed as the green line.
- MACD indicator represents a relationship between two moving averages that is a ratio of Moving Average Convergence/Divergence. The MACD is calculated by subtracting the 26-period Exponential Moving Average (EMA) from the 12-period EMA. A 9-day EMA of the MACD called the "signal line".
- Bollinger Bands is a momentum indicator. The upper and lower bands are typically 2 standard deviations +/- from a 20-day simple moving average.
- Non-commercial traders - speculators such as retail traders, hedge funds and large institutions who use the futures market for speculative purposes and meet certain requirements.
- Non-commercial long positions represent the total long open position of non-commercial traders.
- Non-commercial short positions represent the total short open position of non-commercial traders.
- The overall non-commercial net position balance is the difference between short and long positions of non-commercial traders.