empty
31.10.2023 06:32 AM
EUR/USD and GBP/USD: Technical analysis for October 31

EUR/USD

This image is no longer relevant

Higher Timeframes

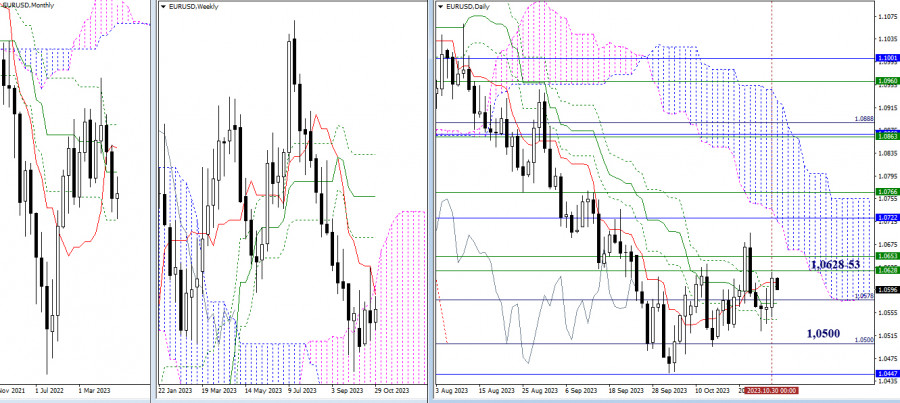
At the end of yesterday, judging by the mood and the shape of the daily candle, it can be said that the advantage during the day belonged to the bullish players. However, one day did not fundamentally change the situation. The main conclusions and expectations remain the same. For the bulls, it is now important to overcome the weekly resistances at 1.0628 – 1.0653 (weekly short-term trend + upper boundary of the weekly cloud). Next, attention will be on updating the high (1.0695) and testing the area of 1.0716-22 (lower boundary of the daily cloud + monthly medium-term trend). The current support and influence on the situation at the moment are provided by the levels of the daily Ichimoku cross (1.0609 – 1.0601 – 1.0572 – 1.0543). The subsequent bearish targets today retain their significance and are located at 1.0500 (daily target level) and 1.0447 (final level of the monthly Ichimoku cross).

This image is no longer relevant

H4 – H1

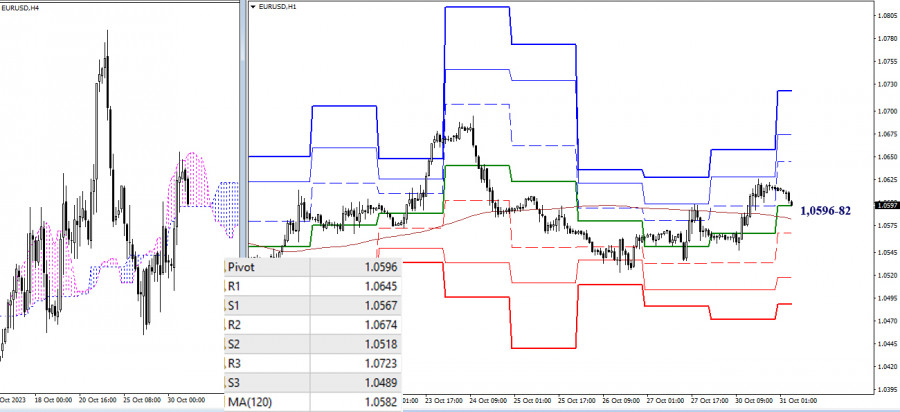
On the lower timeframes, bulls rose above the key levels, turning them into supports. However, they have not been able to reverse the movement yet. In case of further ascent, the next bullish targets within the day can be noted at 1.0645 – 1.0674 – 1.0723 (resistances of classic pivot points). A change in sentiment can happen very quickly now; it is enough for the bears to drop below the key levels located today at 1.0596 – 1.0582 (central pivot point + weekly long-term trend). The next intraday bearish targets are at 1.0567 – 1.0518 – 1.0489 (supports of classic pivot points).

***

GBP/USD

This image is no longer relevant

Higher Timeframes

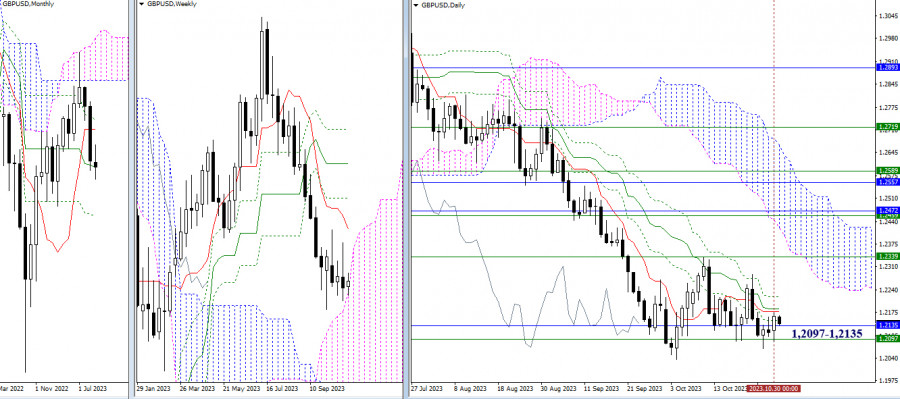
The pound continues to be influenced by the force of attraction of two significant levels in the area of 1.2097 – 1.2135 (upper boundary of the weekly cloud + monthly medium-term trend). Bearish players need an exit from the current zone of attraction and a reliable reversal of the downward trend through the update of the low (1.2036). For the bulls, it is important to eliminate the daily cross (1.2151 – 1.2178 – 1.2186 – 1.2221) and consolidate above the weekly short-term trend (1.2339).

This image is no longer relevant

H4 – H1

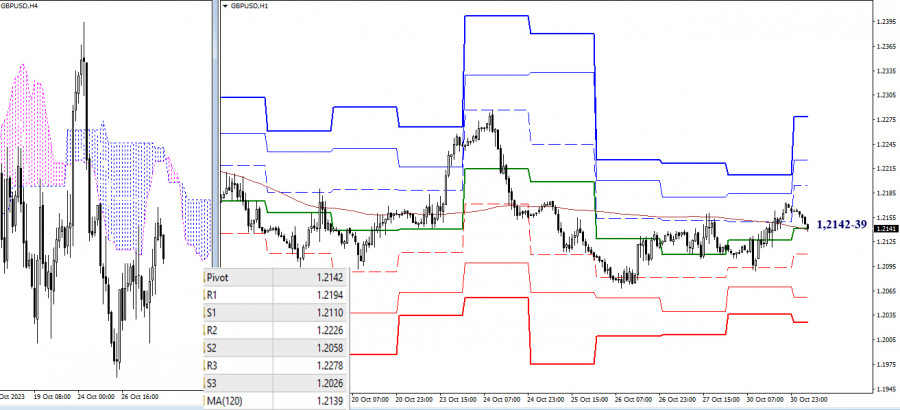
On the lower timeframes, the key levels today have come together in the area of 1.2139 – 1.2142 (weekly long-term trend + central pivot point of the day). Interacting with the key levels, the market seems to be in a point of balance and uncertainty. Trading above the key levels gives the advantage to strengthening bullish sentiments. The resistances of classic pivot points (1.2194 – 1.2296 – 1.2278) can serve as targets for the development of an intraday rise. Trading below the key levels may create conditions for bearish activity and a decline. Intraday bearish targets are at the support levels of classic pivot points (1.2110 – 1.2058 – 1.2026).

***

The technical analysis of the situation uses:

Higher timeframes - Ichimoku Kinko Hyo (9.26.52) + Fibo Kijun levels

Lower timeframes - H1 - Pivot Points (classic) + Moving Average 120 (weekly long-term trend)

Evangelos Poulakis,
الخبير التحليلي لدى شركة إنستافوركس
© 2007-2025
حدد الإطار الزمني
5
د
15
د
30
د
1
س
4
ساعات
1
يوم
1
أسبوع
كسب عائد من تغيرات أسعار العملات المشفرة مع إنستافوركس.
قم بتحميل منصة التداول ميتاتريدر 4 وافتح أول صفقة.
  • Grand Choice
    Contest by
    InstaForex
    InstaForex always strives to help you
    fulfill your biggest dreams.
    انضم إلى المسابقة

المقالات الموصى بها

توقعات اليورو/الدولار الأمريكي ليوم 8 مايو 2025

كما كان متوقعًا، أبقى الاحتياطي الفيدرالي سياسته النقدية دون تغيير بعد اجتماع الأمس. عزز جيروم باول توقعات السوق بشأن ارتفاع التضخم بشكل طفيف فقط. لا تزال الأسواق تتوقع

Laurie Bailey 05:09 2025-05-08 UTC+2

توقعات GBP/USD ليوم 8 مايو 2025

في اجتماع اليوم، من المتوقع أن يقوم بنك إنجلترا بخفض سعر الفائدة الرئيسي من 4.50% إلى 4.25%. وتدعي وسائل الإعلام الاقتصادية أن السوق قد أخذت هذا الحدث في الحسبان وهدأت

Laurie Bailey 05:09 2025-05-08 UTC+2

توقعات USD/JPY ليوم 8 مايو 2025

USD/JPY يظهر الرسم البياني اليومي أن السعر يعكس اتجاهه نحو الأسفل من خطوط قناة السعر الخضراء. حدث أول انعكاس من هذا النوع في 2 مايو، وتم الإشارة إليه بسهم أحمر،

Laurie Bailey 05:09 2025-05-08 UTC+2

تحليل وتوقعات زوج الجنيه الإسترليني/الدولار الأمريكي

اليوم، يتراجع زوج الجنيه الإسترليني/الدولار الأمريكي من الزخم الصعودي الذي شهده بالأمس. هذا التراجع مدعوم بالقوة المتواضعة للدولار الأمريكي. من الناحية الفنية، أظهر الزوج مرونة هذا الأسبوع بالقرب من مستوى

Irina Yanina 19:28 2025-05-07 UTC+2

إشارات التداول للذهب (XAU/USD) للفترة من 7 إلى 9 مايو 2025: الشراء فوق $3,360 (21 SMA - 8/8 Murray)

في بداية الجلسة الأمريكية، يتداول الذهب حول 3,382، مرتداً بعد أن وصل إلى أدنى مستوى له عند 3,359 خلال جلسة الافتتاح. يشير الارتداد الفني القوي إلى احتمال حدوث ارتفاع

Dimitrios Zappas 17:49 2025-05-07 UTC+2

توقعات الفوركس 07/05/2025: اليورو/الدولار الأمريكي، USDX، SP500، الذهب وبيتكوين

روابط مفيدة: مقالاتي الأخرى متوفرة في هذا القسم دورة InstaForex للمبتدئين التحليلات الشائعة افتح حساب تداول مهم: يجب على المبتدئين في تداول الفوركس أن يكونوا حذرين للغاية عند اتخاذ قرارات

Sebastian Seliga 11:04 2025-05-07 UTC+2

EUR/USD - 7 مايو: الثيران يقلبون الاتجاه

يوم الثلاثاء، انقلب الزوج EUR/USD لصالح اليورو وارتفع إلى منطقة المقاومة من 1.1374–1.1383. أدى الارتداد من هذه المنطقة إلى انخفاض لصالح الدولار الأمريكي، مع عودة الزوج نحو مستوى تصحيح فيبوناتشي

Samir Klishi 10:56 2025-05-07 UTC+2

GBP/USD – 7 مايو: عدم اليقين العالمي واللجنة الفيدرالية للسوق المفتوحة

في الرسم البياني لكل ساعة، انعكس زوج الجنيه الإسترليني/الدولار الأمريكي يوم الثلاثاء لصالح الجنيه الإسترليني وأغلق فوق منطقة المقاومة 1.3344–1.3357. لذلك، قد يؤدي الارتداد من هذه المنطقة اليوم مرة أخرى

Samir Klishi 10:52 2025-05-07 UTC+2

التحليل الفني لحركة السعر اللحظية لأزواج العملات المتقاطعة AUD/JPY، الأربعاء 7 مايو 2025.

إذا نظرنا إلى الرسم البياني لمدة 4 ساعات لزوج العملات المتقاطع AUD/JPY، سنرى نمط "وتد متسع هابط" حيث يعطي هذا النمط إشارة إلى أن AUD/JPY لديه إمكانية للارتفاع في المستقبل

Arief Makmur 07:43 2025-05-07 UTC+2

التحليل الفني لحركة السعر اللحظية لأداة سلعة الغاز الطبيعي، الأربعاء 7 مايو 2025.

على الرسم البياني لمدة 4 ساعات، يبدو أن أداة سلعة الغاز الطبيعي لديها نمط هبوطي 123 يتبعه خطاف روس هبوطي (RH) بالإضافة إلى تأكيد أن حركة السعر تحت WMA (21)

Arief Makmur 07:43 2025-05-07 UTC+2
لا تستطيع التحدث الآن؟
اطرح سؤالك في الدردشة.
Widget callback
 

Dear visitor,

Your IP address shows that you are currently located in the USA. If you are a resident of the United States, you are prohibited from using the services of InstaFintech Group including online trading, online transfers, deposit/withdrawal of funds, etc.

If you think you are seeing this message by mistake and your location is not the US, kindly proceed to the website. Otherwise, you must leave the website in order to comply with government restrictions.

Why does your IP address show your location as the USA?

  • - you are using a VPN provided by a hosting company based in the United States;
  • - your IP does not have proper WHOIS records;
  • - an error occurred in the WHOIS geolocation database.

Please confirm whether you are a US resident or not by clicking the relevant button below. If you choose the wrong option, being a US resident, you will not be able to open an account with InstaForex anyway.

We are sorry for any inconvenience caused by this message.