Analyzing Tuesday's trades:
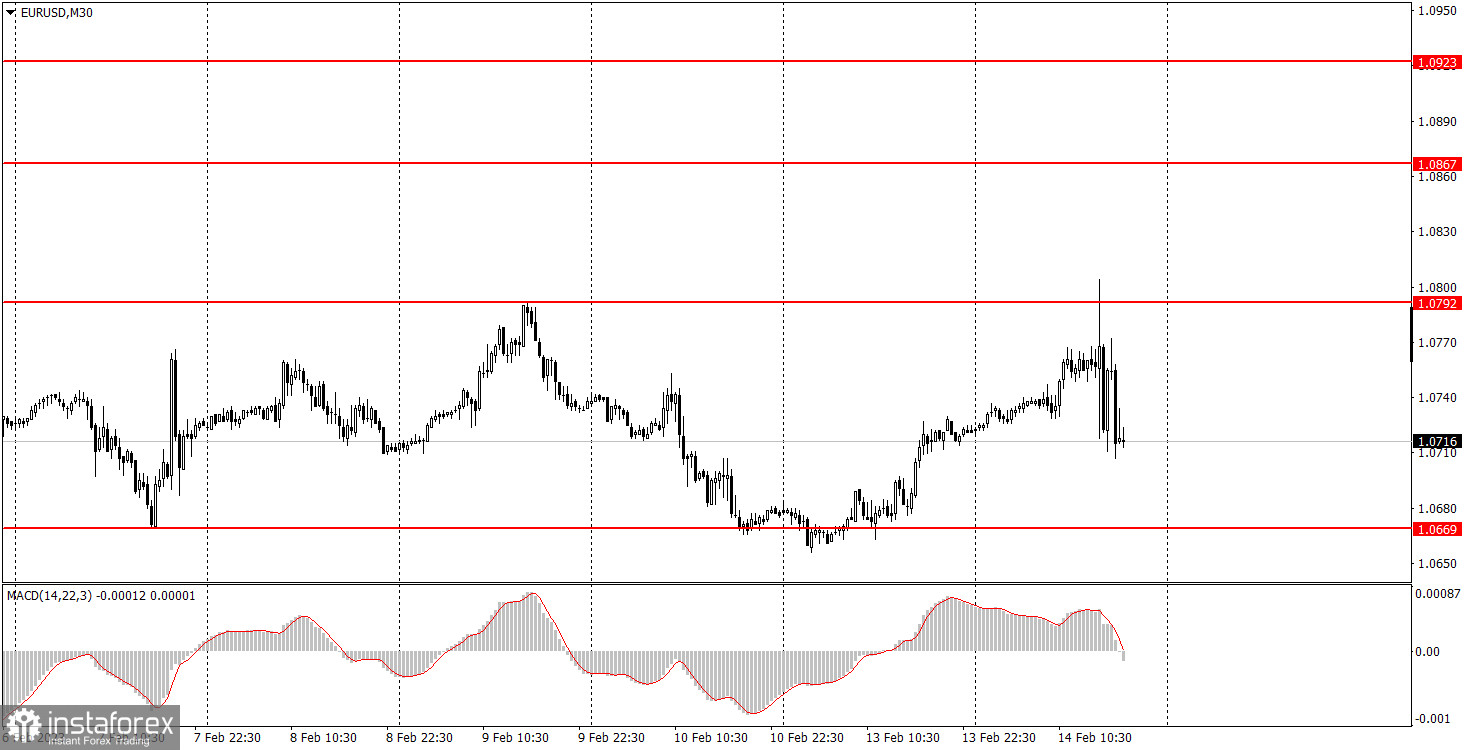
EUR/USD on 30M chart
On Tuesday, EUR/USD traded rather turbulently. Basically, all questions about it disappear if you look at the calendar of macroeconomic events. In a nutshell, the key and most important report of the week on US inflation was just released. The EU released its fourth quarter GDP report in the second estimate, but we already warned you that it was unlikely to be followed by a market reaction. Therefore, the pair showed a very sluggish upward movement during the European session, which bordered on the notion of a flat, and a stormy movement during the US session. As a result of these movements, the pair once again hit a new level at 1.0792, which was formed instead of the two nearby levels. Thus, it looks like that the pair is within the horizontal channel or it formed two rounds of bullish correction, and the second one is more difficult. In fact, the US inflation report should have provoked the strengthening of the dollar. Eventually, the dollar rose, but it was initially falling, which was very strange. We are waiting for a new drop to 1.0669 and a breakthrough.
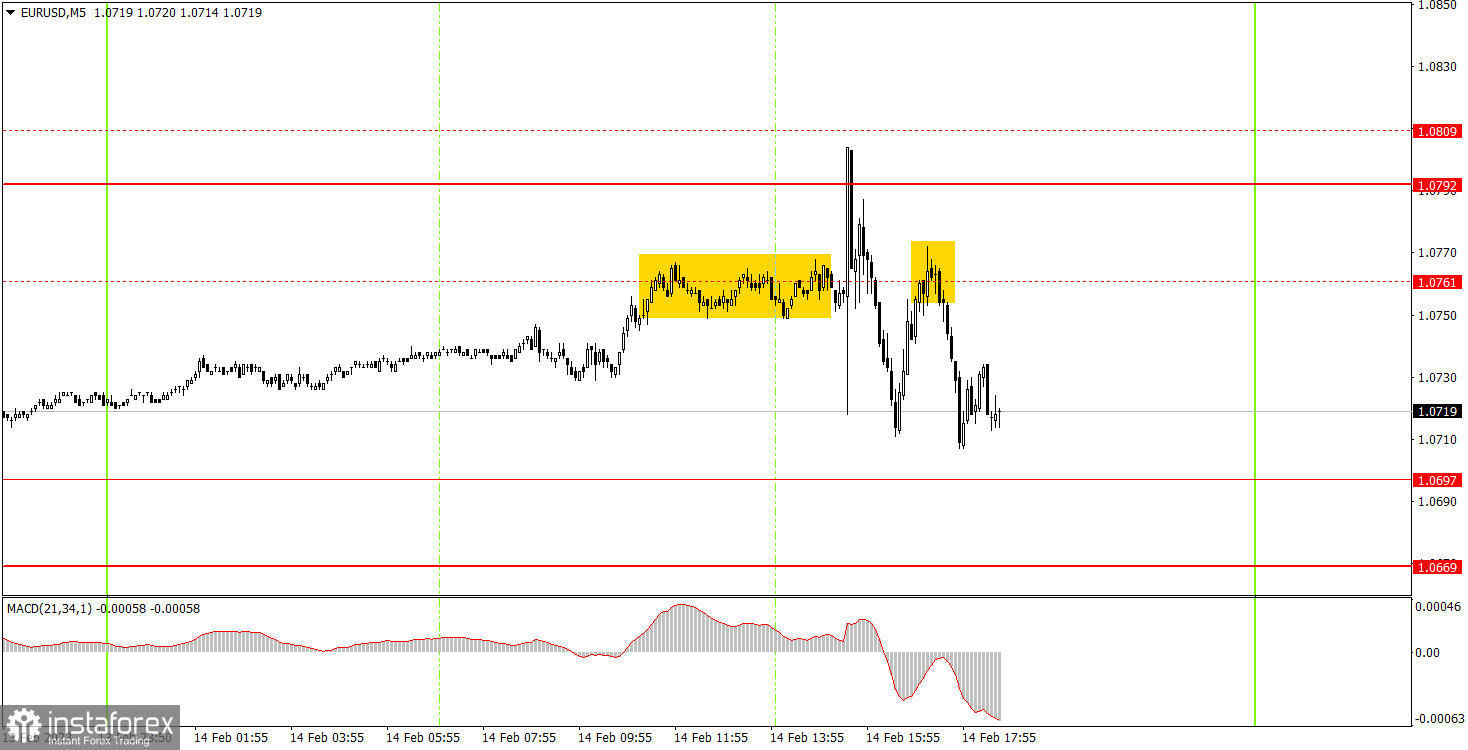
EUR/USD on 5M chart
Speaking of trading signals, everything was quite simple. No signal formed until the release of the U.S. inflation report. The pair reached 1.0761 and simply moved along it. The levels 1.0761 and 1.0809 were removed from the charts. Further movements were absolutely chaotic and it is clear what provoked them. The only signal, which was formed more than an hour after the release, the rebound from 1.0761 could be priced. But it was better not to do it since it was not the most accurate, but rather accidental. Ideally, beginners should not have entered the market on Tuesday.
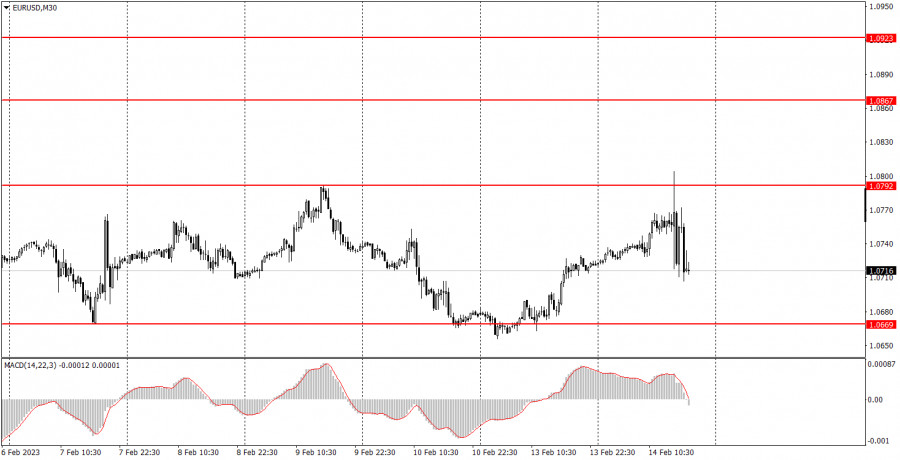
Trading tips on Wednesday:
On the 30-minute chart, the pair tried to form a new round of bullish correction, but it is also difficult to call it successful. The pair barely made it to its previous local high, from which it bounced back quickly and went down. I think that the pair should go back to falling. On the 5-minute chart, it is recommended to trade at the levels 1.0535, 1.0587-1.0607, 1.0669, 1.0697, 1.0792, 1.0857-1.0867. As soon as the price passes 15 pips in the right direction, you should set a Stop Loss to breakeven. On Wednesday, the European Union will release its industrial production report, which is not important in the current circumstances, and the US will release its retail sales and industrial production reports. However, I would like you to focus on European Central Bank President Christine Lagarde's next speech. It could be very important as the ECB is now expected to make statements about future monetary tightening. The U.S. data may provoke a reaction, but probably not a strong one.
Basic rules of the trading system:
1) The strength of the signal is determined by the time it took the signal to form (a rebound or a breakout of the level). The quicker it is formed, the stronger the signal is.
2) If two or more positions were opened near a certain level based on a false signal (which did not trigger a Take Profit or test the nearest target level), then all subsequent signals at this level should be ignored.
3) When trading flat, a pair can form multiple false signals or not form them at all. In any case, it is better to stop trading at the first sign of a flat movement.
4) Trades should be opened in the period between the start of the European session and the middle of the US trading hours when all positions must be closed manually.
5) You can trade using signals from the MACD indicator on the 30-minute time frame only amid strong volatility and a clear trend that should be confirmed by a trendline or a trend channel.
6) If two levels are located too close to each other (from 5 to 15 pips), they should be considered support and resistance levels.
On the chart:
Support and Resistance levels are the levels that serve as targets when buying or selling the pair. You can place Take Profit near these levels.
Red lines are channels or trend lines that display the current trend and show in which direction it is better to trade now.
The MACD indicator (14, 22, and 3) consists of a histogram and a signal line. When they cross, this is a signal to enter the market. It is recommended to use this indicator in combination with trend patterns (channels and trendlines).
Important announcements and economic reports that can be found on the economic calendar can seriously influence the trajectory of a currency pair. Therefore, at the time of their release, we recommend trading as carefully as possible or exiting the market in order to avoid sharp price fluctuations.
Beginners on Forex should remember that not every single trade has to be profitable. The development of a clear strategy and money management is the key to success in trading over a long period of time.