On Wednesday, the EUR/USD currency pair again displayed this type of movement, which is very challenging to reconcile with the macroeconomic backdrop available to traders. The pair has been moving upward for almost the entire day, although, according to detailed macroeconomic statistics, the pair should have alternated between falling and growing throughout the day. Indicators of business activity in the manufacturing and service sectors were released in the European Union in the morning. All three indices were below the crucial level of 50.0, although variations from the predicted values and the previous month's values were negligibly different. Therefore, they could not be regarded as advantageous for the euro currency.
Additionally, business activity indices from the USA were published, either decreasing below the "waterline" or merely remaining below it. Therefore, there was no reason for the dollar to increase. But for some reason, while the euro has not decreased, the dollar has. Orders for long-term goods were among the other reports published in the United States. Even though we don't think this report is significant, a response could have been expected, especially since its value ended up being higher than expected. As a result, everything reported as bad for the euro currency ended up being true, while everything reported as good for it was realized.
In the past week and a half, we have stated this point numerous times: in principle, the entire growth of the euro currency does not correspond to the "foundation." The US dollar cannot lose hundreds of value points simply because inflation in the country has decreased. The same logic applies to the statements made by some Fed members who suggested that the rate may begin to rise more gradually in December. However, it will still keep expanding for a few more months. Additionally, for some reason, the market does not consider Jerome Powell's remarks that the rate may eventually rise more slowly than anticipated. This is, after all, a "hawkish" factor. However, as was already mentioned, the market studiously ignores all the "bullish" elements for the dollar.
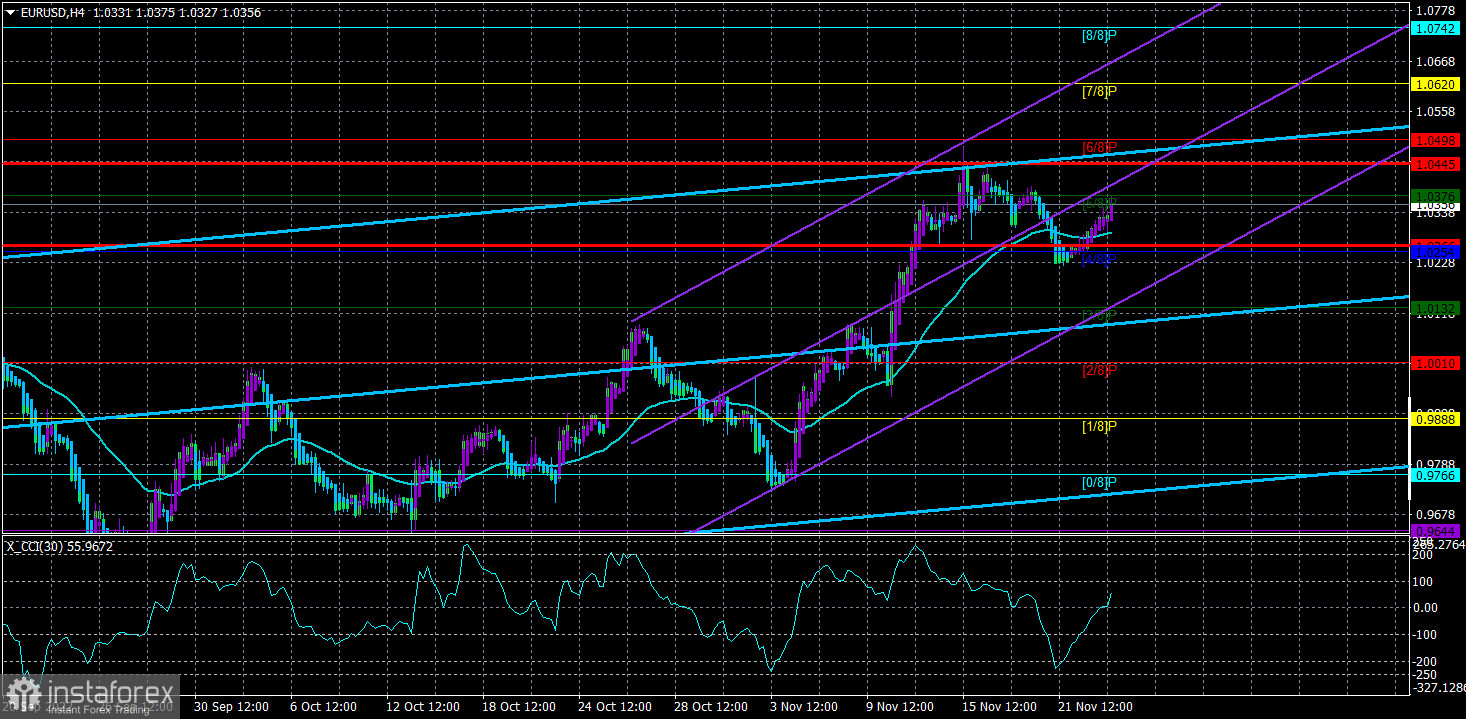
The technical picture on the 24-hour TF is the only factor currently supporting the euro currency. Since the price has crossed all of the Ichimoku indicator's lines, a new uptrend can be formed.
What should we do with this? Now that the pair has moved back into the region above the moving average line, the 4-hour TF is moving upward. As a result, you must make a trade to gain an increase, but keep in mind that this growth is illogical. The pair may consolidate after a long downward trend. If so, a downward consolidation will undoubtedly occur and may appear illogical. The market is about to go through a period of illogical movements.
We also believe that recent movements have been uniformly positive. It can move in a range between 1.0230 and 1.0450. Although it remains challenging to draw such a conclusion with certainty, it is also possible.
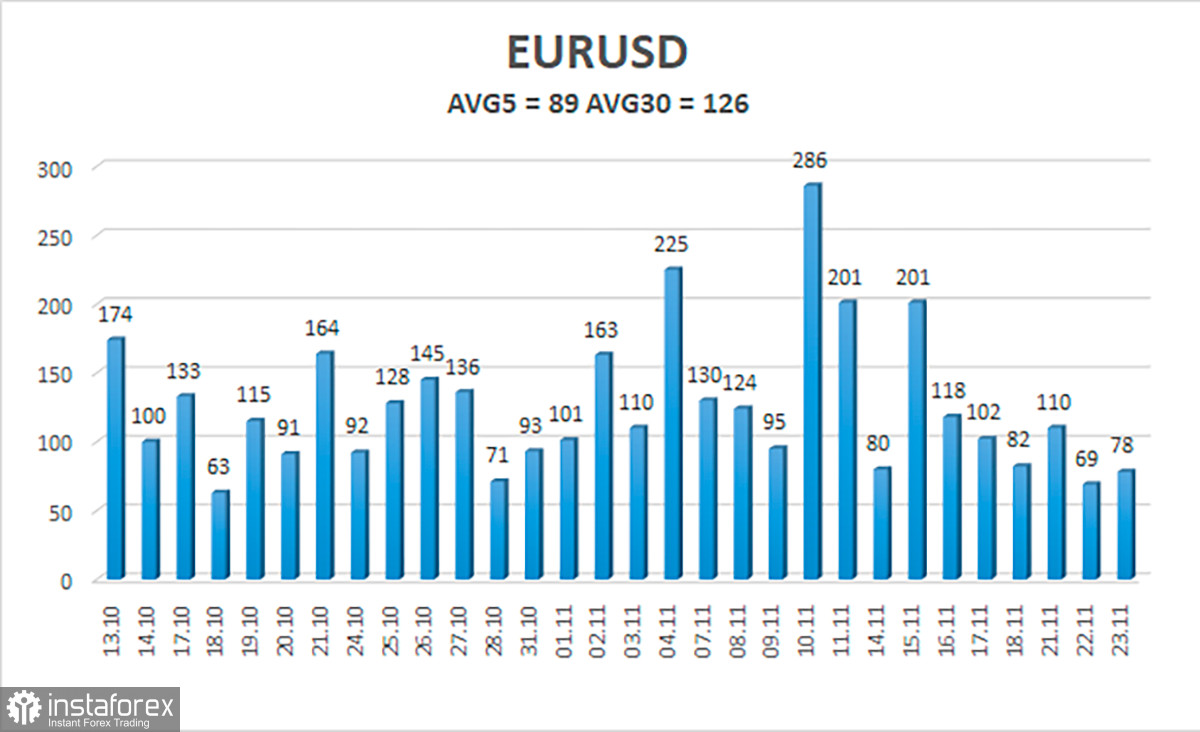
As of November 24, the euro/dollar currency pair's average volatility over the previous five trading days was 89 points, which is considered to be "average." So, on Thursday, we anticipate the pair to fluctuate between 1.0266 and 1.0445. The Heiken Ashi indicator's downward turn indicates that the downward movement may resume.
Nearest levels of support
S1 – 1.0254
S2 – 1.0132
S3 – 1.0010
Nearest levels of resistance:
R1 – 1.0376
R2 – 1.0498
R3 – 1.0620
Trading Suggestion:
The EUR/USD pair has resumed consolidation above the moving average. To avoid the Heiken Ashi indicator turning down, we should now consider opening new long positions with targets of 1.0445 and 1.0498. No earlier than the price fixing below the moving average line with a target of 1.0132 will sales become significant.
Explanations of the illustrations:
Linear regression channels – help determine the current trend. The trend is strong if both are directed in the same direction.
Moving average line (settings 20.0, smoothed) – determines the short-term trend and the direction in which you should trade now.
Murray levels – target levels for movements and corrections.
Volatility levels (red lines) – the likely price channel in which the pair will spend the next day, based on current volatility indicators.
The CCI indicator – its entry into the oversold area (below -250) or into the overbought area (above +250) means that a trend reversal in the opposite direction is approaching.