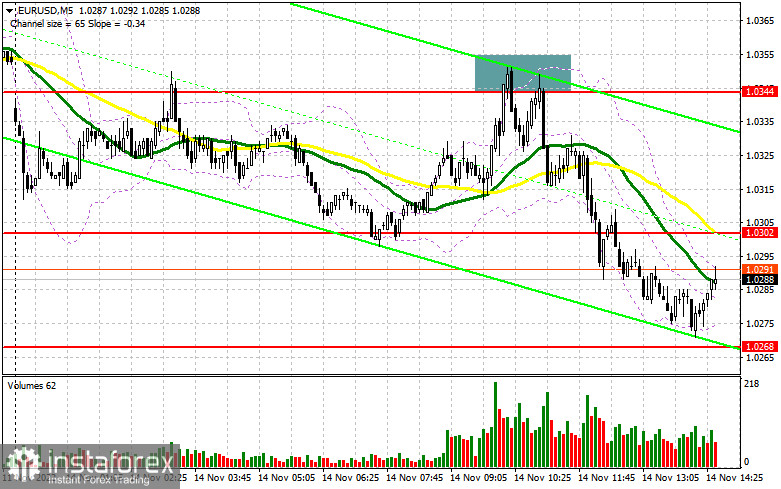
In my morning review, I outlined the level of 1.0344 and recommended entering the market from there. Let's have a look at the pair on the 5-minute chart. The pair swiftly rose to this level in the first half of the day, encouraging the buyers to take profit. This resulted in a false breakout and a sell signal which pushed the pair down to 1.0268. This move allowed us to gain 70 pips in profit. The technical setup has slightly changed in the afternoon.
For long positions on EUR/USD:
Given that no key macroeconomic data is expected in the North American session, the euro bulls may take advantage of this and win back all morning losses. So, traders should especially focus on the level of 1.0268. In case of a downtrend, the best moment to buy the pair will be a false breakout of this level. This will validate the opening of long positions, considering the continuation of the uptrend. Such a scenario may bring the pair back to the resistance of 1.0307 that was formed in the first half of the day. A breakout and a downward retest of this range will pave the way to the area of 1.0347 and will give more confidence to the buyers. If so, the pair may have a chance to move higher to 1.0375 where I recommend profit taking. If EUR/USD declines and bulls are idle at 1.0268 in the North American session, this may trigger massive profit taking and, consequently, a drop in the euro. In this case, you can buy the pair only after a false breakout at the support of 1.0227 above which the moving averages are located. Buying EUR/USD right after a rebound is possible only at the support of 1.0180 or near the low of 1.0132. Bear in mind a possible upside correction of 30-35 pips within the day.
For short positions on EUR/USD:
The sellers have reached their goals. Now the main question is whether the real buyers of risk assets are still in the market and whether the euro will come under more pressure when news from the last week is digested by market players. A good scenario for opening short positions will be a false breakout near the new resistance level of 1.0307 where the price may move in the second half of the day. Only a false breakout at 1.0307 will open the door to the downward target of 1.0268. Consolidation of the price below this range and its upward retest will create another sell signal that may trigger stop-loss orders set by the bulls. If so, the euro may drop to 1.0227 where I recommend profit taking. The price may move below this level on strong political news. We are talking about the G20 summit. If EUR/USD rises and bears are idle at 1.0307 in the North American session, bulls will continue to gain momentum and may send the pair up to the level of 1.0347. If there is no trading activity there as well, I would recommend selling the pair only when it reaches 1.0375. The formation of a false breakout at this level will act as an additional entry point for short positions. Selling EUR/USD right after a rebound is possible only from the high of 1.0402, keeping in mind a possible correction of 30-35 pips within the day.
COT report:
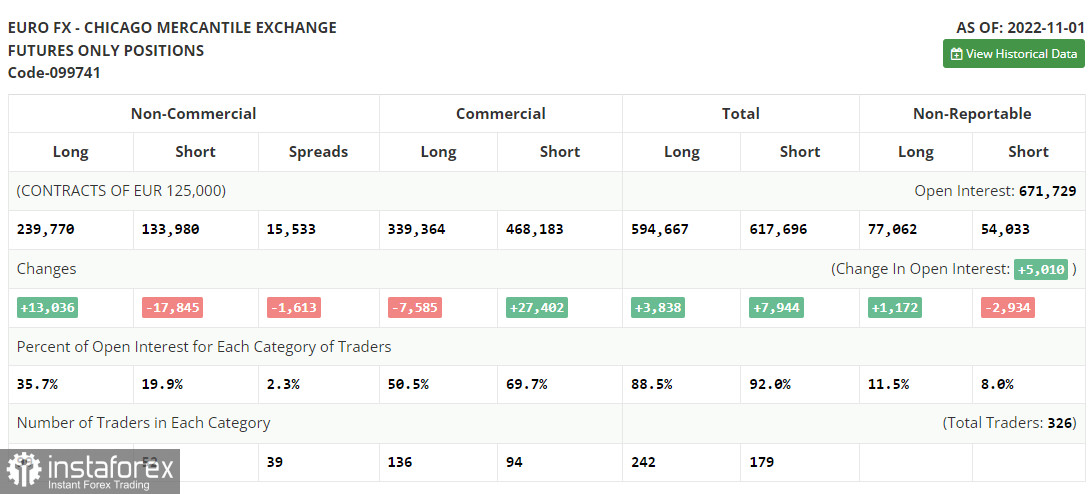
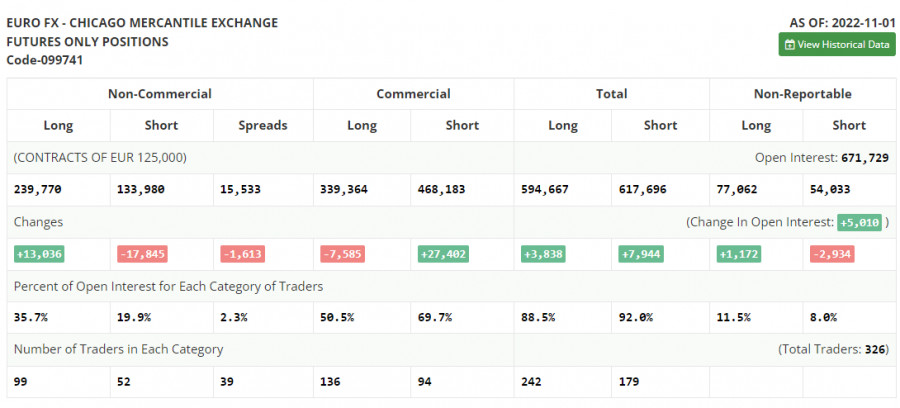
The Commitment of Traders report for November 1 showed a decline in short positions and a rise in the long ones. The US dollar keeps losing ground against risk assets even though the US Federal Reserve sticks to its aggressive monetary policy. Traders anticipate that this tightening cycle will come to an end in the spring of next year. Then the regulator is expected to gradually lower the rate which will naturally boost the demand for the euro. This week, the US CPI data may serve as such a driver. Inflation is the main factor that the Fed is taking into account when deciding on its policy. If the consumer price index shows that inflation has eased, the greenback will weaken further and the euro will easily settle above the parity level. At the same time, the upside potential of the European currency is somehow limited. The thing is that after raising interest rates, the ECB hinted that this aggressive policy may soon be revised, especially if the eurozone economy continues to contract at a rapid pace. According to the latest COT report, the long positions of the non-commercial group of traders went up by 13,036 to 239,770 while short positions dropped by 17,845 to 133,980. At the end of the week, the non-commercial net position remained positive and stood at 105,790 versus 74,909. This indicates that investors are taking advantage of a cheaper euro and continue to buy it while it is holding below the parity level. They might also be accumulating long positions in hope that the pair will start to recover sooner or later. The weekly closing price declined to 0.9918 from 1.0000.
Indicator signals:
Moving Averages
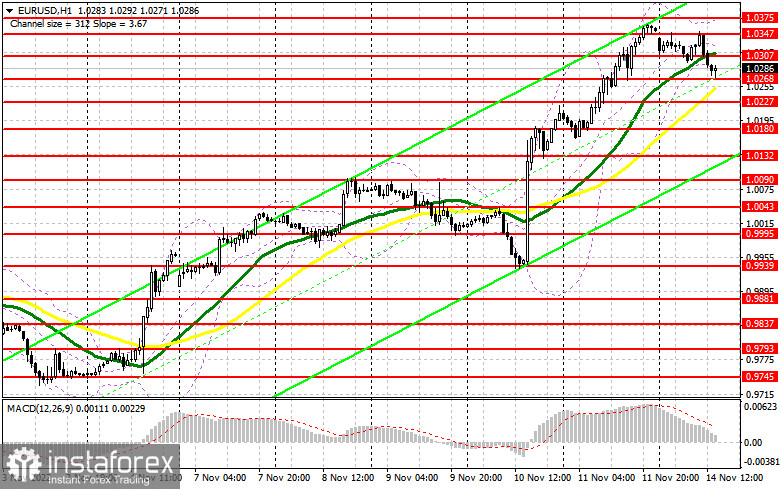
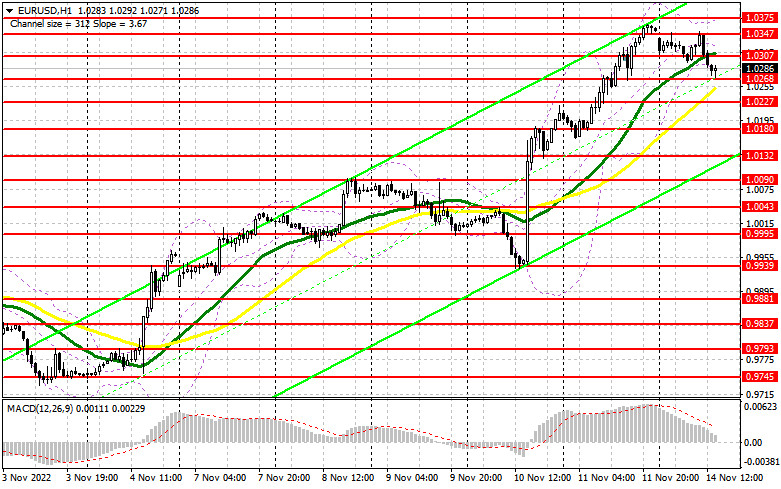
Trading above the 30- and 50-day moving averages indicates that the euro will continue to rise.
Please note that the time period and levels of the moving averages are analyzed only for the H1 chart, which differs from the general definition of the classic daily moving averages on the D1 chart.
Bollinger Bands
In case of a downward movement, the lower band of the indicator at 1.0210 will serve as support.
Description of indicators:
• A moving average of a 50-day period determines the current trend by smoothing volatility and noise; marked in yellow on the chart;
• A moving average of a 30-day period determines the current trend by smoothing volatility and noise; marked in green on the chart;
• MACD Indicator (Moving Average Convergence/Divergence) Fast EMA with a 12-day period; Slow EMA with a 26-day period. SMA with a 9-day period;
• Bollinger Bands: 20-day period;
• Non-commercial traders are speculators such as individual traders, hedge funds, and large institutions who use the futures market for speculative purposes and meet certain requirements;
• Long non-commercial positions represent the total number of long positions opened by non-commercial traders;
• Short non-commercial positions represent the total number of short positions opened by non-commercial traders;
• The non-commercial net position is the difference between short and long positions of non-commercial traders.