Bitcoin continues to trade with low volatility and has been stagnant for several days. The price has broken the upward structure on the hourly time frame, previously worked out the nearest "bearish" FVG on the daily time frame, and then reached the "bullish" FVG on the daily chart without receiving any reaction. Thus, signs of a downward trend reversal are becoming increasingly evident. The only missing element is the market's desire to sell or buy.
Expert traders have regularly pointed out over the last month that the current rise is likely a manipulation by market makers, a "bull trap," and simply a basic correction. Spot interest in Bitcoin remains low, and spot transactions are the driver of a sustainable trend. The market has grown exclusively due to futures positions, which are typically short-term and speculative. Therefore, a long-term trend cannot be built on them.
Meanwhile, analysts from Glassnode reported that about 10% of Bitcoin's issuance is at risk of being hacked due to quantum computers. The company stated that a quantum-resistant mechanism needs to be implemented to address this issue. The coins at risk were mined in the earliest stages of Bitcoin's life and have outdated Public-to-Public-Key formats or outdated Pay-to-Multisig structures. These coins are designed in such a way that their public key is visible on the blockchain and cannot be hidden. Coins from organizations and funds, such as Franklin Templeton, WisdomTree, Robinhood, Revolut, and Grayscale, are also at risk. Additionally, another 20% of coins are deemed "operationally unsafe." Approximately 70% of Bitcoin's issuance is considered completely risk-free in terms of quantum computing and hacking.
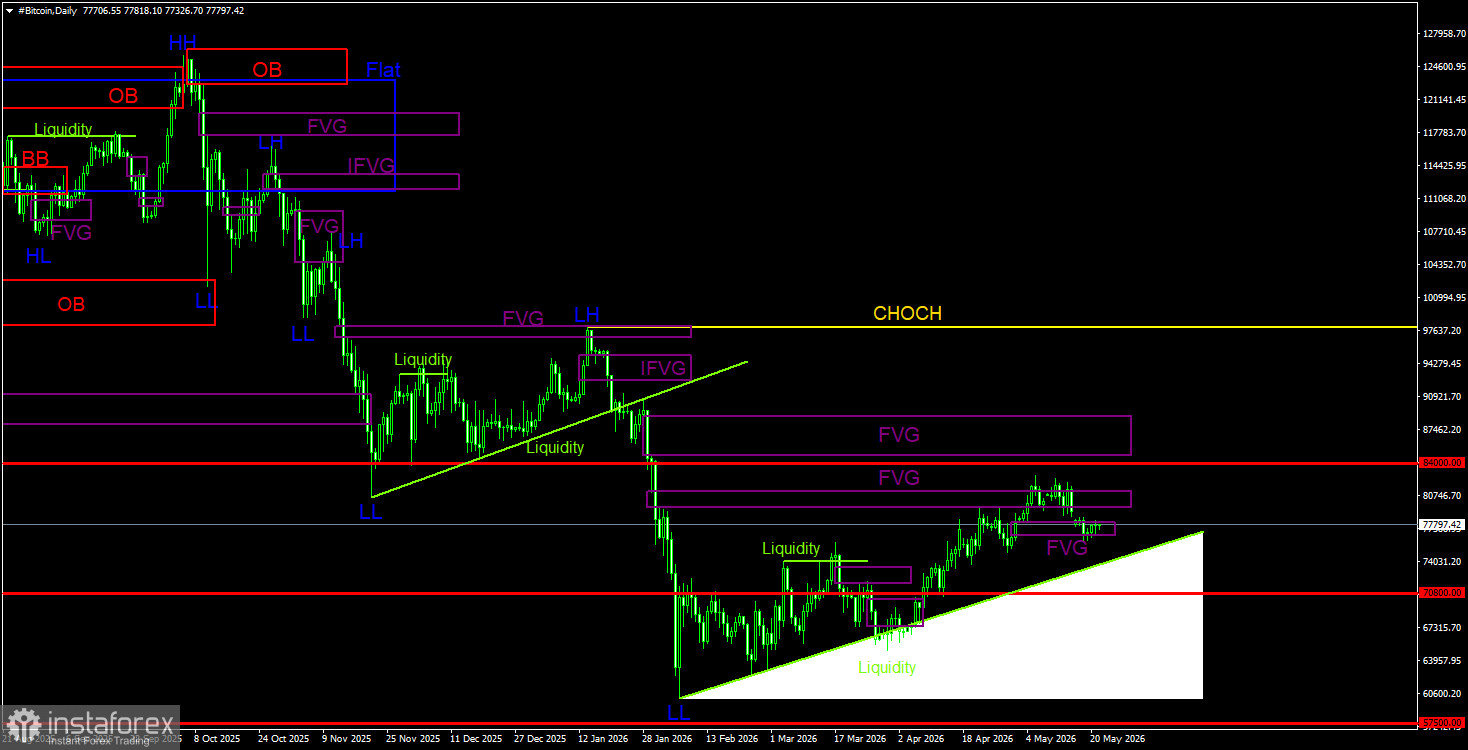
Overall Picture of BTC/USD on 1D
On the daily time frame, Bitcoin continues to form a downward trend and is correcting against it. The trend structure is identified as downward, and the CHOCH line remains at the level of $97,900. Only above this level can it be considered that the downward trend has ended. As there are no signs of an upward trend reversal, we believe a decline will resume sooner or later. On the daily time frame, the nearest POI area for sell trades is in the range of $79,500 – $81,100. This area has been worked out several times, but the market's response has been weak. However, on the hourly time frame, the upward structure has been broken, so the probability of Bitcoin's decline increases. Currently, there has been no reaction to the bullish FVG, or the response has been very weak.
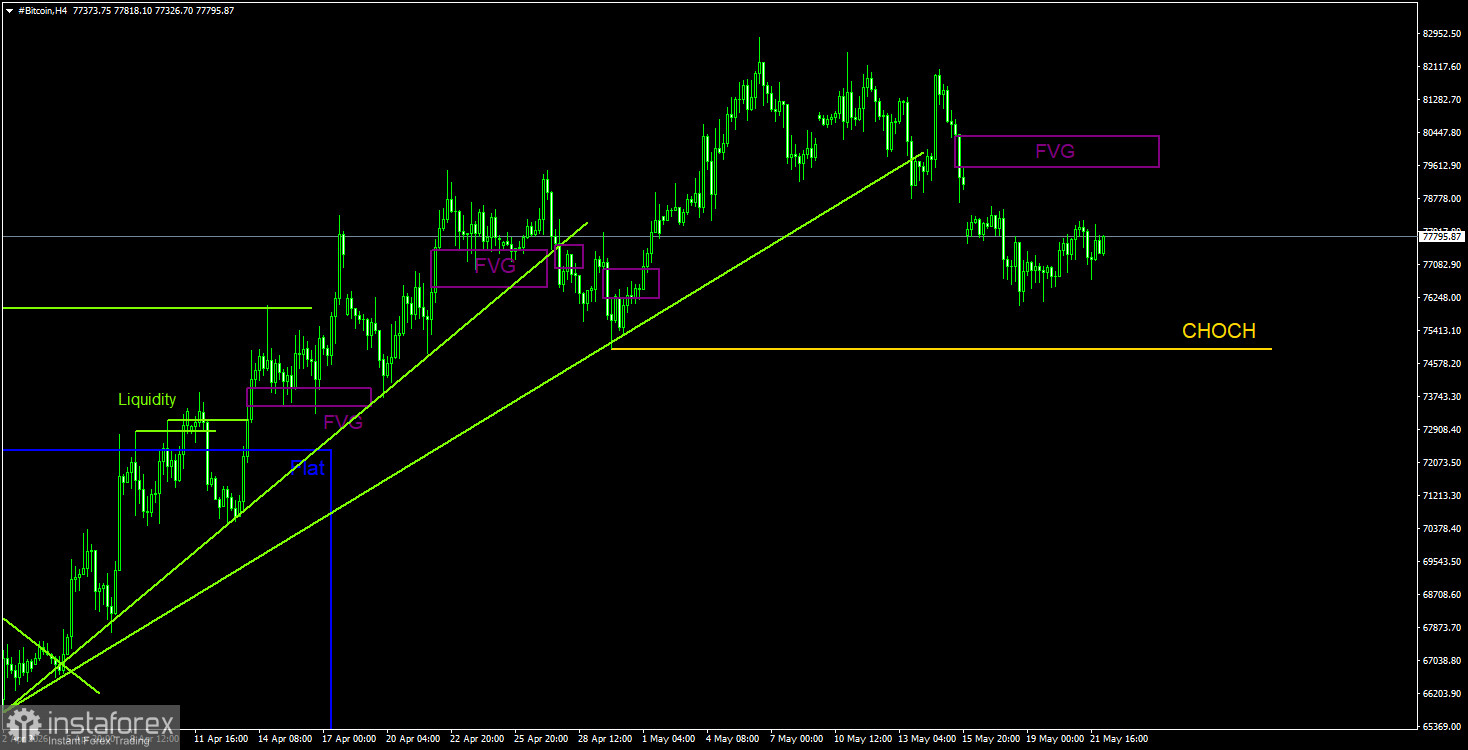
Overall Picture of BTC/USD on 4H
On the 4-hour time frame, Bitcoin is correcting against the correction. The CHOCH line of the current upward structure is at $74,950; a close below this level will signal a trend breakdown. This could be a significant signal for the market, indicating a trend change. The end of the upward trend on the 4-hour time frame can serve as a starting point for a new round of the trend on the daily time frame. There are still no fundamental reasons for Bitcoin's long-term strengthening, and spot demand remains very weak. Daily, there are increasing signals indicating the completion of a three-month correction. The only bearish FVG on the 4-hour time frame may provide an opportunity to open short positions.
Trading Recommendations for BTC/USD:
Bitcoin continues to form a complete downward trend and corrects against it. We continue to expect a decline targeting $57,500 (the 61.8% Fibonacci level from a three-year upward trend), and there are still no signs of the beginning of a long-term upward trend. Among the POI areas, we can currently note only the nearest bearish FVG on the daily time frame, located in the $79,300 - $81,200 range. There was indeed a sell signal in this area (on the second attempt), which was confirmed on the hourly time frame. Thus, we are inclined to resume the downward trend in the near future, and bearish patterns on the 4-hour time frame can be used to open short positions.
Explanations for the Illustrations:
- CHOCH – Trend structure break.
- Liquidity – Liquidity, Stop Loss, and pending orders that market makers use to build their positions.
- FVG – Area of price inefficiency. The price passes through such areas very quickly, indicating a complete absence of one side in the market. Subsequently, the price tends to return and receive a reaction from such areas in continuation of the main trend.
- IFVG – Inverted area of price inefficiency. After returning to such an area, the price does not react; instead, it impulsively breaks through and then tests from the other side.
- OB – Order block. The candle on which the market maker opened a position with the aim of collecting liquidity to form their position in the opposite direction.