empty
17.11.2022 01:34 PM
Technical analysis of EUR/USD for November 17, 2022

This image is no longer relevant

Overview :

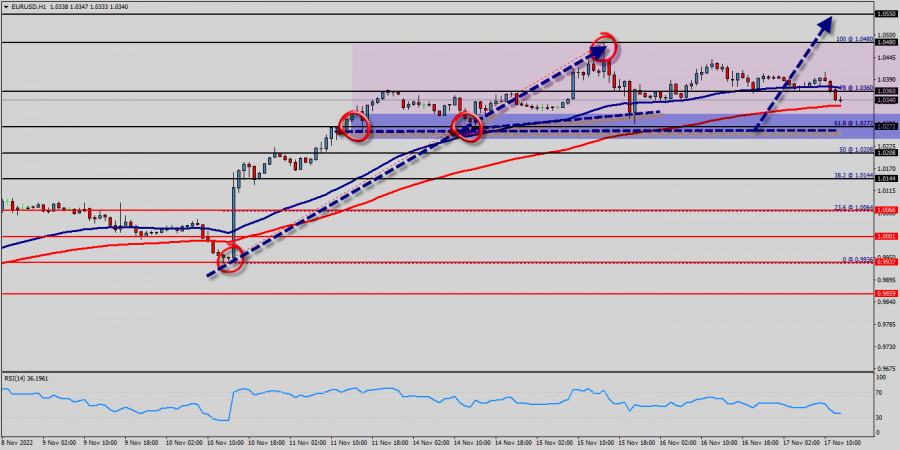
The EUR/USD pair's rise from 1.0272 is still in progress and intraday bias stays on the upside for 1.0272 resistance first on the one-hour chart. All elements being clearly bullish market, it would be possible for traders to trade only long positions on the EUR/USD pair as long as the price remains well above the price of 1.0272. The EUR/USD pair will continue rising from the level of 1.0272 in the long term. It should be noted that the support is established at the level of 1.0272 which represents the daily pivot point. The price is likely to form a double bottom in the same time frame. Accordingly, the EUR/USD pair is showing signs of strength following a breakout of the highest level of 1.0340. This suggests that the pair will probably go up in coming hours.

If the trend is able to break the level of 1.0340, then the market will call for a strong bullish market towards the objectives between 1.0272 ans 1.0480 this week. Currently, the price is in a bullish channel. This is confirmed by the RSI indicator signaling that we are still in a bullish trending market. As the price is still above the moving average (100), immediate support is seen at 1.0272, which coincides with a key ratio (61.8% of Fibonacci). The EUR/USD pair swing around the breached resistance of the bullish channel and keeps its stability above it until now, noticing that the EMA50 continues to resistance the price from above, while RSI begins to overlap positively.

Thus, the market is indicating a bullish opportunity above the above-mentioned support levels, for that the bullish outlook remains the same as long as the 100 EMA is headed to the upside. So, buy above the level of 1.0340 with the first target at 1.0360 in order to test the daily resistance 1. The buyers' bullish objective is set at the level of 1.0480. A bullish break in this resistance would boost the bullish momentum. The buyers could then target the resistance located at 1.0480. If there is any crossing, the next objective would be the resistance located at 1.0480. The level of 1.0550 is a good place to take profits.

Moreover, the RSI is still signaling that the trend is upward as it remains strong above the moving average (100). However, beware of bullish excesses that could lead to a possible short-term correction; but this possible correction would not be tradeable.

On the other hand, in case a reversal takes place and the EUR/USD pair breaks through the support level of 1.0272, a further decline to 1.0208 and 1.0144 can occur. It would indicate a bearish market.

เลือกช่วงเวลา
5
นาที
15
นาที
30
นาที
1
ชั่วโมง
4
ชั่วโมง
1
วัน
1
สัปดาห์
รับผลกำไรจากการเปลี่ยนแปลงอัตราสกุลเงินดิจิทัลกับ InstaForex.
ดาวน์โหลด MetaTrader 4 และเปิดการซื้อขายครั้งแรกของคุณ.
  • Grand Choice
    Contest by
    InstaForex
    InstaForex always strives to help you
    fulfill your biggest dreams.
    เข้าร่วมการแข่งขัน


บทความแนะนำ

การวิเคราะห์ทางเทคนิคของการเคลื่อนไหวราคาภายในวันของคู่สกุลเงินไขว้ AUD/JPY วันพุธที่ 23 เมษายน 2025

ด้วยการเกิดความแตกต่างระหว่างการเคลื่อนไหวของราคาในคู่สกุลเงิน AUD/JPY กับตัวบ่งชี้ Stochastic Oscillator และการเคลื่อนไหวของราคา AUD/JPY ที่อยู่เหนือ WMA (30 Shift 2) ซึ่งมีแนวโน้มสูงขึ้น ดังนั้นอิงตามข้อเท็จจริงทั้งสองข้อนี้ AUD/JPY

Arief Makmur 06:37 2025-04-23 UTC+2

การวิเคราะห์ทางเทคนิคของการเคลื่อนไหวราคาทองคำภายในวัน, วันพุธที่ 23 เมษายน 2025

หากเราพิจารณากราฟ 4 ชั่วโมง จะเห็นว่าเครื่องมือการเงิน Gold ยังคงเคลื่อนไหวในแนวโน้ม Bullish แต่การปรากฏของ Divergence ระหว่างการเคลื่อนไหวของราคาทองคำกับตัวชี้วัด Stochastic Oscillator บ่งบอกว่าในอนาคตอันใกล้นี้ ทองคำอาจเผชิญการปรับฐานอ่อนตัวลงไปสู่ระดับ 3310.31

Arief Makmur 06:37 2025-04-23 UTC+2

การคาดการณ์ค่าเงินต่างประเทศ 22/04/2025: EUR/USD, GBP/USD, USD/JPY และ Bitcoin

ลิงก์ที่เป็นประโยชน์: บทความอื่นๆ ของฉันสามารถอ่านได้ในส่วนนี้ คอร์สพื้นฐาน InstaForex สำหรับผู้เริ่มต้น การวิเคราะห์ยอดนิยม เปิดบัญชีซื้อขาย สำคัญ: สำหรับผู้เริ่มต้นในการเทรดฟอเร็กซ์ ควรระมัดระวังเป็นพิเศษเมื่อทำการตัดสินใจเกี่ยวกับการเข้าสู่ตลาด ก่อนที่รายงานสำคัญจะออก ควรหลีกเลี่ยงการเข้าตลาดเพื่อป้องกันการถูกกระทบจากความผันผวนของตลาดที่เพิ่มขึ้น หากตัดสินใจเทรดในช่วงที่มีการประกาศข่าว ควรตั้ง

Sebastian Seliga 10:08 2025-04-22 UTC+2

การวิเคราะห์ทางเทคนิคของการเคลื่อนไหวของราคาในระหว่างวันของคู่สกุลเงิน GBP/CHF, วันอังคารที่ 22 เมษายน 2025

หากเราพิจารณากราฟ 4 ชั่วโมงของคู่สกุลเงิน GBP/CHF จะพบข้อเท็จจริงที่น่าสนใจหลายประการ ประการแรก การปรากฏตัวของรูปแบบ Triangle ตามด้วยการเคลื่อนไหวของ EMA (21) ที่เคลื่อนที่ระหว่างตัวแท่งเทียนบ่งชี้ว่าสถานการณ์ปัจจุบันของ GBP/CHF กำลังเคลื่อนที่ในลักษณะ Sideways

Arief Makmur 06:58 2025-04-22 UTC+2

การวิเคราะห์ทางเทคนิคของการเคลื่อนไหวราคาภายในวันของคู่เงินครอส AUD/CAD วันอังคารที่ 22 เมษายน 2025

ด้วยการเคลื่อนไหวของราคาคู่เงินตรา AUD/CAD ที่เคลื่อนขึ้นเหนือเส้น WMA (21) ที่มีความชันไปทางขาขึ้น และการปรากฏของสัญญาณการบรรจบกันระหว่างการเคลื่อนไหวของราคา AUD/CAD กับตัวบ่งชี้ Stochastic Oscillator นั้นแสดงให้เห็นว่ามีโอกาสที่ในอนาคตอันใกล้จะแข็งค่าขึ้นไปถึงระดับ 0.8896 หากสามารถทะลุระดับนี้ไปได้และปิดสูงกว่า ก็จะทำให้

Arief Makmur 06:58 2025-04-22 UTC+2

สัญญาณการซื้อขายสำหรับทองคำ (XAU/USD) ระหว่างวันที่ 21-25 เมษายน 2025: ขายต่ำกว่า $3,422 (ซื้อมากเกินไป - 8/8 Murray)

ในช่วงต้นของการซื้อขายในสหรัฐอเมริกา ทองคำกำลังเคลื่อนที่ในทางขาขึ้นอย่างแข็งแรงหลังวันหยุดอีสเตอร์ ถึงระดับสูงสุดตลอดกาลใหม่ที่ประมาณ 3,406 ทางเทคนิคแล้ว ทองคำมีศักยภาพในการขึ้นไปได้สูง และมีแนวโน้มที่จะถึงจุดสูงสุดในแนวโน้มขาขึ้นระหว่าง 3,422 และ 3,430 บริเวณนี้เป็นจุดสำคัญเนื่องจากทองคำอาจเจอแรงต่อต้านรุนแรง ซึ่งอาจถือเป็นโอกาสในการขาย อย่างไรก็ตาม เราเชื่อว่าทองคำอาจกลับไปที่ระดับ 3,330

Dimitrios Zappas 17:23 2025-04-21 UTC+2

การวิเคราะห์ทางเทคนิคของการเคลื่อนไหวของราคาภายในวัน คู่สกุลเงินข้าม EUR/GBP วันจันทร์ที่ 21 เมษายน 2025

จากที่เห็นในกราฟ 4 ชั่วโมง คู่สกุลเงิน EUR/GBP ดูเหมือนจะเคลื่อนไหวเหนือเส้น EMA (100) ซึ่งบ่งบอกว่าผู้ซื้อมีอิทธิพลเหนือคู่สกุลเงินนี้ ดังนั้นในอนาคตอันใกล้ ตราบใดที่ไม่มีการแก้ไขที่อ่อนแอที่ทะลุและปิดต่ำกว่าระดับ 0.8521 EUR/GBP มีโอกาสที่จะคุ้มค่าและเพิ่มขึ้นถึงระดับ 0.8613

Arief Makmur 04:19 2025-04-21 UTC+2

การวิเคราะห์ทางเทคนิคของการเคลื่อนไหวของราคาในระหว่างวัน คู่สกุลเงินหลัก USD/JPY วันจันทร์ที่ 21 เมษายน 2025

จากการเกิดการบรรจบกันระหว่างการเคลื่อนไหวของราคาของคู่สกุลเงินหลัก USD/JPY กับตัวชี้วัด Stochastic Oscillator และตำแหน่งของ EMA (100) ที่อยู่เหนือราคานั้น ในอนาคตอันใกล้นี้ USD/JPY มีแนวโน้มที่จะอ่อนค่าลงต่อไป โดยตราบใดที่ยังไม่มีการเสริมกำลังเพิ่มเติมที่ฝ่าและปิดเหนือระดับ 149.43 USD/JPY

Arief Makmur 04:19 2025-04-21 UTC+2

การคาดการณ์ Forex ประจำวันที่ 18/04/2025: EUR/USD, GBP/USD, ทองคำ และ Bitcoin

ลิงก์ที่เป็นประโยชน์: บทความอื่น ๆ ของฉันสามารถอ่านได้ในส่วนนี้ คอร์สเริ่มต้น InstaForex สำหรับผู้เริ่มต้น การวิเคราะห์ที่ได้รับความนิยม เปิดบัญชีซื้อขาย สำคัญ: ผู้เริ่มต้นในตลาดฟอเร็กซ์ต้องระมัดระวังอย่างมากในการตัดสินใจเข้าสู่ตลาด ก่อนที่รายงานสำคัญจะถูกปล่อยออกมา คุณควรออกจากตลาดก่อน เพื่อหลีกเลี่ยงผลกระทบของความผันผวนที่เพิ่มขึ้น หากคุณตัดสินใจทำการซื้อขายในขณะนี้

Sebastian Seliga 10:18 2025-04-18 UTC+2

ทองคำ: ความไม่แน่นอนที่เกิดขึ้นอย่างต่อเนื่องยังคงสนับสนุนราคาทองคำ

ราคาทองคำยังคงได้รับแรงสนับสนุนท่ามกลางความไม่แน่นอนเกี่ยวกับเส้นทางในอนาคตของสงครามภาษีที่ริเริ่มโดย Donald Trump ราคาทองคำได้พุ่งสูงขึ้นอย่างต่อเนื่องเป็นเวลากว่า 4 เดือน โดยปัจจัยหลักคือความหวาดกลัวที่เพิ่มขึ้นว่าศักยภาพทางเศรษฐกิจโลกอาจพังทลายลงภายใต้ความตึงเครียดที่เพิ่มขึ้น—โดยเฉพาะการเผชิญหน้าระหว่างปักกิ่งและวอชิงตัน ในเชิงเทคนิคแล้ว ราคาของโลหะมีค่านี้มีการซื้อมากเกินไปและอาจพังทลายลงได้ทุกเมื่อหากมีข่าวเกี่ยวกับข้อตกลงทางการค้าระหว่างสหรัฐฯ และจีนปรากฏออกมา แม้ยังไม่มีจุดจบที่ชัดเจนสำหรับการเผชิญหน้านี้ แต่เมื่อพิจารณาจากท่าทีที่เด็ดเดี่ยวของปักกิ่ง การเดินเกมของ Trump และความเสี่ยงทางเศรษฐกิจที่แท้จริง—โดยเฉพาะในสหรัฐฯ—จึงถือเป็นเรื่องสมเหตุสมผลที่จะคาดหวังว่าการเจรจาระหว่างทั้งสองประเทศจะเริ่มขึ้นในที่สุด

Pati Gani 11:49 2025-04-17 UTC+2
หากไม่สะดวกคุยในตอนนี้
ระบุคำถามไว้ได้ใน แชท.
Widget callback
 

Dear visitor,

Your IP address shows that you are currently located in the USA. If you are a resident of the United States, you are prohibited from using the services of InstaFintech Group including online trading, online transfers, deposit/withdrawal of funds, etc.

If you think you are seeing this message by mistake and your location is not the US, kindly proceed to the website. Otherwise, you must leave the website in order to comply with government restrictions.

Why does your IP address show your location as the USA?

  • - you are using a VPN provided by a hosting company based in the United States;
  • - your IP does not have proper WHOIS records;
  • - an error occurred in the WHOIS geolocation database.

Please confirm whether you are a US resident or not by clicking the relevant button below. If you choose the wrong option, being a US resident, you will not be able to open an account with InstaForex anyway.

We are sorry for any inconvenience caused by this message.