empty
27.01.2022 12:00 PM
Technical analysis recommendations of EUR/USD and GBP/USD on January 27, 2022

EUR/USD

This image is no longer relevant

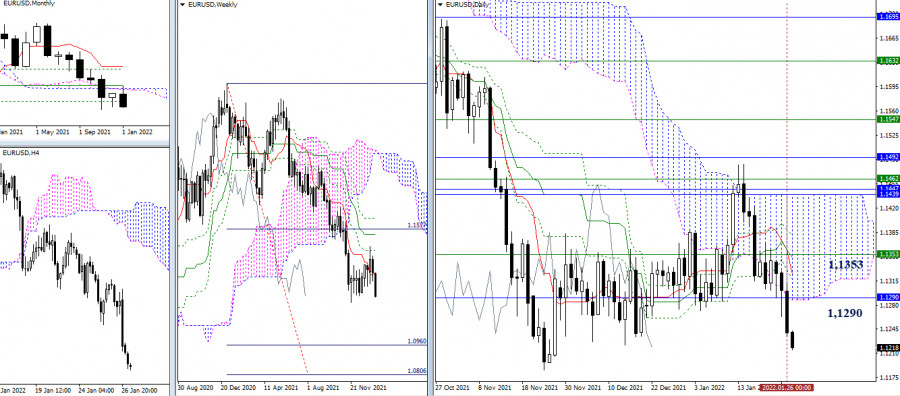
The bears implemented a decline. Now, their interests are focused on breaking through the minimum extreme (1.1186) and restoring the weekly downward trend. After that, attention can be directed again to the breakdown of the weekly downside target for the breakdown of the Ichimoku cloud (1.0806 - 1.0960). The levels of 1.1353 - 1.1290 (weekly short-term trend + final level of the monthly cross + daily levels), which we managed to break yesterday, still remain important. They still exert their influence and attraction on the situation.

This image is no longer relevant

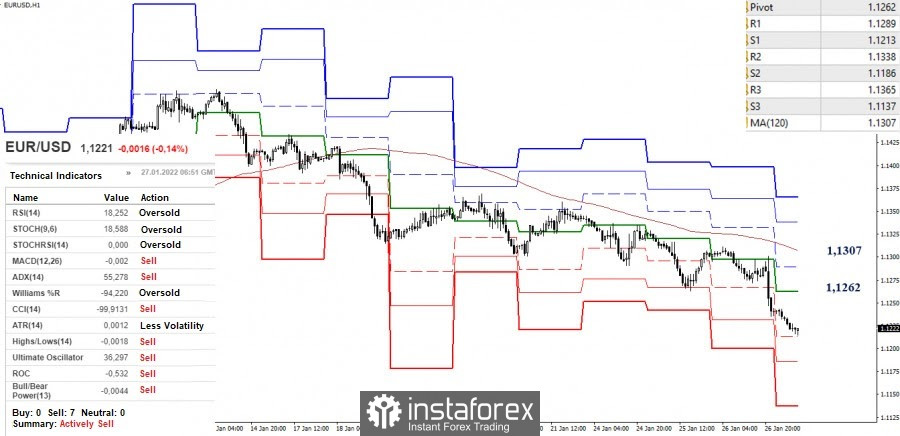
The upward corrections during the previous days could not take away the main advantage from the bears, who continue to dominate and update new lows. As they further decline, they have reached the first support of the classic pivot levels (1.1213). The next support points are set at S2 (1.1186) and S3 (1.1137). The key levels in the smaller timeframes currently act as resistance, so they can come into operation with the development of the next upward correction. The key levels are now located at 1.1262 (central pivot level) and 1.1307 (weekly long-term trend).

GBP/USD

This image is no longer relevant

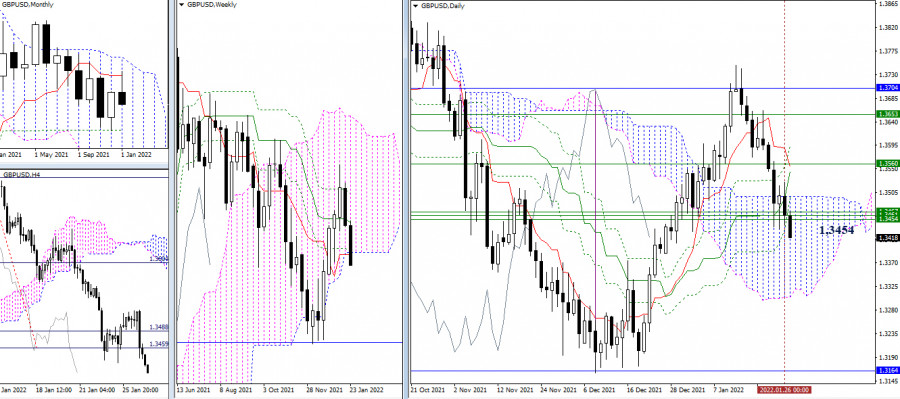
Yesterday, the bulls failed to implement the emerging rebound. The pair returned to the support level of 1.3454 (accumulation of weekly levels) and try to break through it again. The downward pivot points here now include 1.3304 (lower border of the daily cloud) and 1.3164 (monthly Fibo Kijun).

This image is no longer relevant

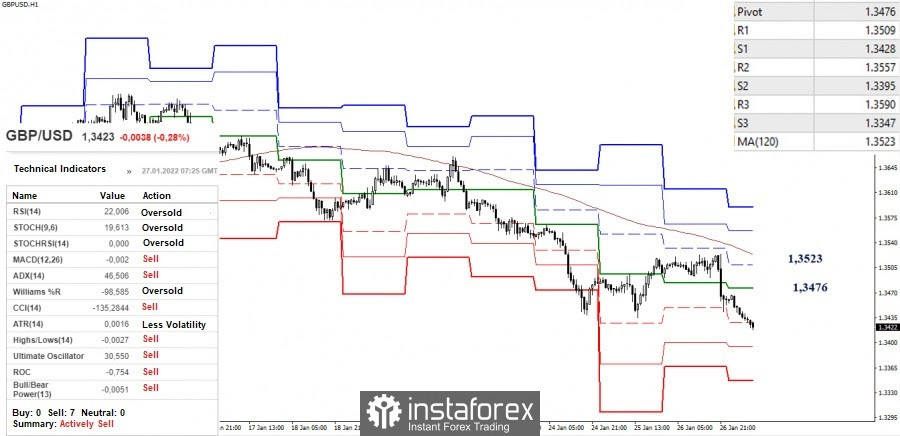
The correction ended in the smaller timeframes with the bears having the advantage. They are back in a downward trend. At the moment, S1 (1.3428) is being tested. The next pivot points for the intraday decline are the support of the classic pivot levels of 1.3395 (S2) and 1.3347 (S3), while the key levels responsible for the balance of power are seen at 1.3476 (central pivot level) and 1.3523 (weekly long-term trend). A consolidation above and reversal of the moving average can affect the current balance of forces.

***

Ichimoku Kinko Hyo (9.26.52) and Kijun-sen levels in the higher time frames, as well as classic Pivot Points and Moving Average (120) on the H1 chart, are used in the technical analysis of the trading instruments.

เลือกช่วงเวลา
5
นาที
15
นาที
30
นาที
1
ชั่วโมง
4
ชั่วโมง
1
วัน
1
สัปดาห์
รับผลกำไรจากการเปลี่ยนแปลงอัตราสกุลเงินดิจิทัลกับ InstaForex.
ดาวน์โหลด MetaTrader 4 และเปิดการซื้อขายครั้งแรกของคุณ.
  • Grand Choice
    Contest by
    InstaForex
    InstaForex always strives to help you
    fulfill your biggest dreams.
    เข้าร่วมการแข่งขัน


บทความแนะนำ

การวิเคราะห์ทางเทคนิคเกี่ยวกับการเคลื่อนไหวของราคาภายในวันของคู่เงินข้าม AUD/JPY ประจำวันพุธที่ 14 พฤษภาคม 2025

แม้ว่าในกรอบเวลา 4 ชั่วโมง คู่สกุลเงิน AUD/JPY ยังคงเคลื่อนที่อยู่เหนือเส้น WMA (30 Shift 2) ซึ่งมีแนวโน้มที่สูงขึ้น แต่ด้วยเพราะดัชนี Stochastic Oscillator อยู่เหนือระดับ

Arief Makmur 07:42 2025-05-14 UTC+2

การวิเคราะห์ทางเทคนิคของการเคลื่อนไหวราคาประจำวันในเครื่องมือสินค้าโภคภัณฑ์น้ำมันดิบ วันพุธที่ 14 พฤษภาคม 2025

จากสิ่งที่เห็นในกราฟ 4 ชั่วโมงของเครื่องมือสินค้าพลังงานน้ำมันดิบปรากฏข้อสังเกตที่น่าสนใจหลายประการ ประการแรกคือการเกิดรูปแบบ Double Bottom ที่ตามมาด้วยการบรรจบกันระหว่างการเคลื่อนไหวของราคา #CL และตัวบ่งชี้ Stochastic Oscillator ประการที่สอง คือการปรากฏของรูปแบบ Bullish Dragon

Arief Makmur 07:42 2025-05-14 UTC+2

การคาดการณ์ค่าเงิน EUR/USD สำหรับวันที่ 14 พฤษภาคม 2025

ในวันอังคาร ยูโรเลือกที่จะไม่ต่อต้านอารมณ์ของตลาดต่อไปและเข้าร่วมกับแนวโน้มที่เปิดรับความเสี่ยงมากขึ้น ดัชนีหุ้นสหรัฐ S&P 500 เพิ่มขึ้น 0.72% ดัชนีดอลลาร์ลดลง 0.76% และค่าเงินยูโรแข็งค่าขึ้น 0.88% (99 จุด) ยูโรยังได้รับแรงหนุนจากข้อมูลความเชื่อมั่นทางเศรษฐกิจ

Laurie Bailey 05:03 2025-05-14 UTC+2

การคาดการณ์ GBP/USD สำหรับวันที่ 14 พฤษภาคม 2025

ท่ามกลางการเพิ่มขึ้นของการรับความเสี่ยงและความเชื่อมั่นในตลาดทั่วไปเมื่อวานนี้ (S&P 500 +0.72%, WTI +2.78%, Dollar Index -0.76%) เงินปอนด์อังกฤษไม่ได้พยายามทดสอบแนวรับที่ระดับเป้าหมายที่ 1.3101 แต่กลับเคลื่อนไหวขึ้นไปและถึงระดับแนวต้านที่ 1.3311 แทน เช้าวันนี้

Laurie Bailey 05:03 2025-05-14 UTC+2

การพยากรณ์ AUD/USD สำหรับวันที่ 14 พฤษภาคม 2025

ดอลลาร์ออสเตรเลียได้เบรกขึ้นเหนือกรอบ 0.6394–0.6444 เส้นสัญญาณของ Marlin oscillator ได้กลับทิศทางขึ้นก่อนที่จะถึงขอบเขตของโซนขาลง เมื่อพิจารณาถึงความผันผวนที่เป็นไปได้ การอนุญาตให้ oscillator ทดสอบขอบเขตนั้นจึงเป็นไปได้ ราคาในขณะนี้มุ่งมั่นเป้าหมายสำคัญที่กรอบ 0.6640/95 อย่างมั่นใจ ในกราฟ

Laurie Bailey 05:03 2025-05-14 UTC+2

สัญญาณการซื้อขายสำหรับ GOLD ระหว่างวันที่ 12-15 พฤษภาคม 2025: ซื้อเมื่อราคาสูงกว่า $3,225 (200 EMA - 6/8 Murray)

ในช่วงต้นของตลาดอเมริกา ทองคำกำลังซื้อขายอยู่ราว 3,249 ฟื้นตัวหลังจากที่ได้แตะจุดต่ำสุดที่ 3,224 ซึ่งใกล้เคียงกับ 200 EMA หลังจากการลงไปถึงจุดต่ำสุดนี้ ทองคำกำลังฟื้นตัวกลับมาอย่างมั่นใจ ขณะนี้ถึงระดับสูงสุดของช่องขาลงแล้ว หากทะลุผ่านได้อย่างเด็ดขาด ทองคำคาดว่าจะขึ้นต่อไป ถ้าหากทองคำทะลุและยืนอยู่เหนือ 3,250

Dimitrios Zappas 18:50 2025-05-13 UTC+2

สัญญาณการเทรดสำหรับ EUR/USD ระหว่างวันที่ 13-19 พฤษภาคม 2025: ขายต่ำกว่า 1.1184 (200 EMA - 21 SMA)

ในช่วงต้นของการซื้อขายตลาดอเมริกา ยูโรอยู่ที่ประมาณ 1.1171 ต่ำกว่า 200 EMA และต่ำกว่า 21 SMA ในแผนภูมิ H4 เราจะเห็นว่า หลังจากยูโรแตะจุดต่ำสุดที่ 1.1070 ได้ฟื้นตัวทางเทคนิคไปยังเขตค่าเฉลี่ยเคลื่อนที่

Dimitrios Zappas 18:49 2025-05-13 UTC+2

การคาดการณ์อัตราแลกเปลี่ยน 13/05/2025: EUR/USD, GBP/USD, SP500, น้ำมัน, ทองคำ และ Bitcoin

ลิงก์ที่มีประโยชน์: บทความอื่นๆ ของฉันสามารถอ่านได้ในส่วนนี้ คอร์สเบื้องต้นของ InstaForex สำหรับผู้เริ่มต้น การวิเคราะห์ยอดนิยม เปิดบัญชีเทรด สำคัญ: ผู้เริ่มต้นในการเทรดฟอเร็กซ์ควรระมัดระวังอย่างมากเมื่อทำการตัดสินใจเกี่ยวกับการเข้าสู่ตลาด ก่อนการประกาศรายงานสำคัญ การออกจากตลาดถือเป็นทางเลือกที่ดีที่สุดเพื่อหลีกเลี่ยงการติดอยู่ในสถานการณ์ที่มีความผันผวนสูง หากคุณตัดสินใจที่จะเทรดระหว่างที่มีข่าวออก คุณควรวางคำสั่งหยุดการขาดทุนเสมอเพื่อที่จะลดการสูญเสีย หากไม่วางคำสั่งหยุดการขาดทุน

Sebastian Seliga 12:00 2025-05-13 UTC+2

การพยากรณ์สำหรับ EUR/USD วันที่ 13 พฤษภาคม 2025

เมื่อวันจันทร์ คู่เงิน EUR/USD ยังคงลดลงต่อเนื่องหลังจากดีดตัวจากโซนแนวต้านที่ 1.1265–1.1282 ในวันศุกร์ คู่เงินได้รวมตัวต่ำกว่าระดับฟีโบนัชชีที่ 127.2% ที่ 1.1181 และตกลงไปยังโซนแนวรับที่ 1.1074–1.1081 การดีดตัวจากโซนนี้ส่งผลดีต่อยูโรและคู่เงินเริ่มขึ้นสู่ระดับปรับฐานที่ 1.1181 การรวมตัวต่ำกว่าโซนนี้จะเพิ่มโอกาสในการลดลงไปยังโซนแนวรับถัดไปที่

Samir Klishi 11:02 2025-05-13 UTC+2

GBP/USD – 13 พฤษภาคม: อัตราการว่างงานในอังกฤษเพิ่มขึ้นอีกครั้ง

ในกราฟรายชั่วโมง คู่เงิน GBP/USD ร่วงลงถึงระดับ 1.3139 ในวันจันทร์ แล้วดีดตัวขึ้นจากระดับดังกล่าว และเพิ่มขึ้นถึงระดับฟีโบนักชี 100.0% ที่ 1.3205 การดีดกลับจากระดับนี้จะสนับสนุนดอลลาร์สหรัฐและส่งผลให้มีการลดลงใหม่ไปที่ระดับ 1.3085 และ 1.3139

Samir Klishi 10:49 2025-05-13 UTC+2
หากไม่สะดวกคุยในตอนนี้
ระบุคำถามไว้ได้ใน แชท.
Widget callback
 

Dear visitor,

Your IP address shows that you are currently located in the USA. If you are a resident of the United States, you are prohibited from using the services of InstaFintech Group including online trading, online transfers, deposit/withdrawal of funds, etc.

If you think you are seeing this message by mistake and your location is not the US, kindly proceed to the website. Otherwise, you must leave the website in order to comply with government restrictions.

Why does your IP address show your location as the USA?

  • - you are using a VPN provided by a hosting company based in the United States;
  • - your IP does not have proper WHOIS records;
  • - an error occurred in the WHOIS geolocation database.

Please confirm whether you are a US resident or not by clicking the relevant button below. If you choose the wrong option, being a US resident, you will not be able to open an account with InstaForex anyway.

We are sorry for any inconvenience caused by this message.