empty
10.12.2021 01:32 PM
EUR/USD: trading plan for North American session on December 10, analysis of morning trades. EUR depreciates slowly ahead of US CPI report

For opening long positions on EUR/USD:

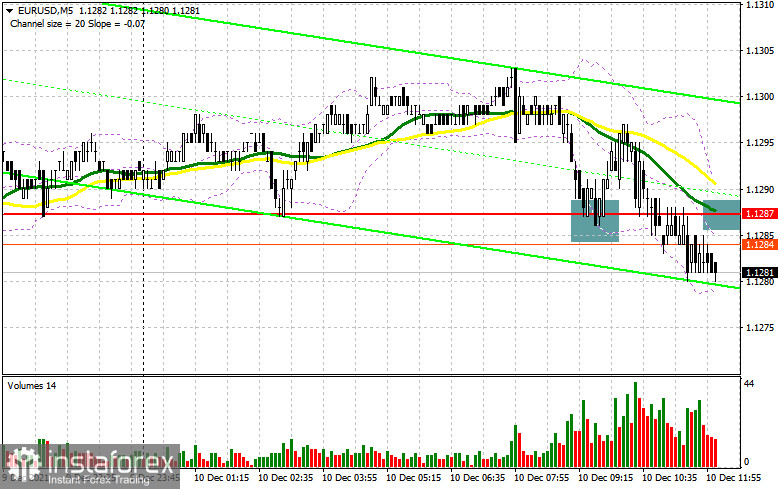
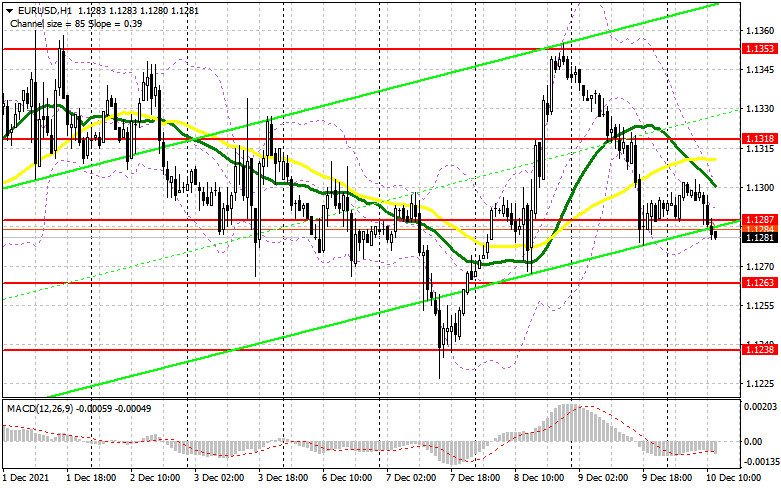
In my morning forecast, I paid attention to the level of 1.1287 and recommended entering the market from it. Let's take a look at the 5-minute chart and see what happened. After the release of the inflation data in Germany, which came in line with the forecast, buyers of the European currency made an attempt to protect the support level of 1.1287. The formation of a false breakout generated a good signal to open long positions given that the bear market would end soon. However, this did not result in a strong rise. After a slight upward movement of 12 pips, the euro was back under pressure, and bears managed to break below 1.1287. At the time of writing, the price still hasn't retested this level from bottom to top, so I advise you not to rush into the market.

This image is no longer relevant

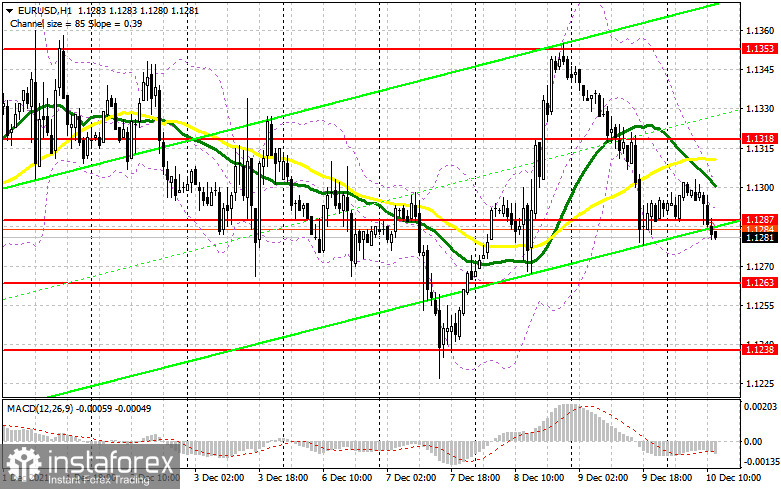
In the second half of the day, market participants are waiting for important data on inflation in the US which will determine the further direction of the pair. If the report shows a larger increase in the consumer price index for November, the US dollar could significantly strengthen against the euro. As a result, the EUR/USD pair will depreciate. For buyers of the euro, the best scenario for the North American session will be a return to the level of 1.1287. A breakout and consolidation above this range, together with declining US inflation, is likely to restore risk appetite. This will form an excellent entry point for long positions on EUR/USD, considering that the immediate resistance at 1.1318 will be retested. Moving averages are located below this level, which will limit the upward potential of the pair. Only a breakout can seriously affect the EUR/USD downtrend, so be very careful at this level. A breakout and a downside test of 1.1318 would form a larger rally towards the 1.1353 and 1.1381 highs. A further target will be the level of 1.1415 where I recommend taking profit. If the bearish pressure on the euro persists in the afternoon, it is better to postpone purchases until the price hits the support at 1.1263. But most likely, this level will be just an intermediate point. Therefore, you can open long positions at this level only after a false breakout is formed. I advise you to buy EUR/USD immediately on a rebound from the low of 1.1238 or even lower - around 1.1214, considering the possible upward correction of 20-25 pips within the day.

For opening short positions on EUR/USD:

Sellers are gradually returning to the market. After bears have reached the 1.1287 level, there is every indication that they are ready to act if inflation in the US surges again. The best scenario for selling the pair would be after a retest of the level of 1.1287 from bottom to top. This will form an entry point for opening short positions with the prospect of the euro falling to the area of intermediate support at 1.1263. However, the more important target will be the level of 1.1238. Only a breakout and a test from bottom to top of the 1.1263 level will form a sell signal with a further decline in this range. The next target will be the area of 1.1214 where traders will take profit. It is difficult to say, though, how the euro will behave. A breakout of this range will resume the downtrend, and the price may then retest the lows of 1.1188 and 1.1155. If the pair recovers later in the day, I advise you not to rush with opening short positions. The best scenario would be selling the pair when a false breakout is formed in the 1.1318 area. Selling EUR/USD immediately on a rebound is possible from the highs of 1.1353 and 1.1381, considering the possible upward correction of 20-25 pips within the day.

This image is no longer relevant

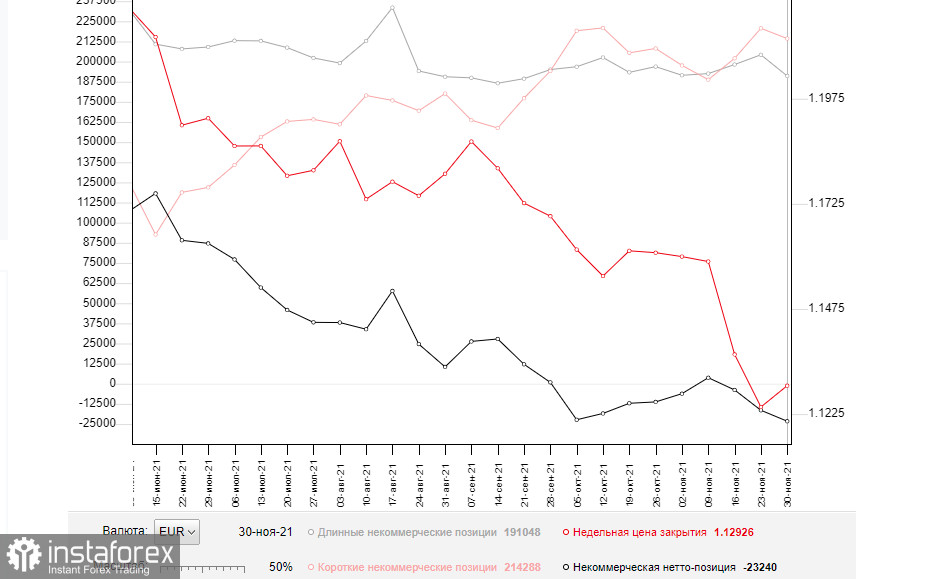
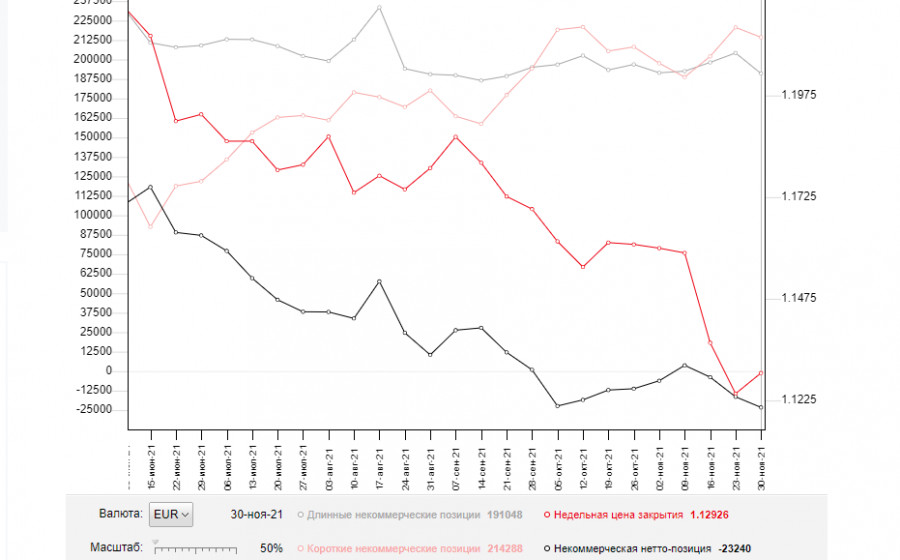
The COT report (Commitment of Traders) for November 30 showed a decline in both short and long positions. However, the rate of reduction in long positions was higher, thus increasing the negative delta. Last week, Fed's Chair Jerome Powell made several statements about the expected tightening of the monetary policy. The reason behind this is the ever rising inflation rate which is no longer considered temporary. This is a matter of concern for the central bank. The second problem was the new Omicron coronavirus strain which will stall the global economy late this year and early next year. It also dampens demand for risk assets. Next week, the Fed is expected to make a decision on the bond purchase program at its regular meeting. So, demand for the US dollar is likely to stay high in the short term. The latest November COT report indicated that the number of long positions of the non-commercial group of traders fell from 204,214 to 191,048, while the short ones declined from 220,666 to 214,288. At the end of the week, the total non-commercial net position increased to -23,240 versus -16,452. The weekly closing price, on the other hand, increased significantly - to 1.1292 versus 1.1241.

This image is no longer relevant

Indicator signals

Moving averages

If the pair is trading below the 30- and 50-day moving averages, this indicates that bears are ready to act.

Please note that the author analyzes the time period and prices of moving averages for the H1 chart which differs from the general definition of the classic daily moving averages on the D1 chart.

Bollinger Bands

A breakout of the lower band boundary around 1.1280 will increase the pressure on the pair. In case of growth, the upper boundary of the indicator at 1.1310 will act as resistance.

Description of indicators

• A moving average determines the current trend by smoothing volatility and noise. 50-day period; marked in yellow on the chart;

• A moving average determines the current trend by smoothing volatility and noise. 30-day period; marked in green on the chart;

• Indicator MACD (Moving Average Convergence / Divergence) Fast EMA, 12-day period; Slow EMA, 26-day period. SMA – 9-day period;

• Bollinger Bands: 20-day period;

• Non-commercial traders are speculators such as individual traders, hedge funds, and large institutions who use the futures market for speculative purposes and meet certain requirements;

• Long non-commercial positions represent the total number of long open positions of non-commercial traders;

• Short non-commercial positions represent the total number of short open positions of non-commercial traders;

• The total non-commercial net position is the difference between short and long positions of non-commercial traders.

เลือกช่วงเวลา
5
นาที
15
นาที
30
นาที
1
ชั่วโมง
4
ชั่วโมง
1
วัน
1
สัปดาห์
รับผลกำไรจากการเปลี่ยนแปลงอัตราสกุลเงินดิจิทัลกับ InstaForex.
ดาวน์โหลด MetaTrader 4 และเปิดการซื้อขายครั้งแรกของคุณ.
  • Grand Choice
    Contest by
    InstaForex
    InstaForex always strives to help you
    fulfill your biggest dreams.
    เข้าร่วมการแข่งขัน


บทความแนะนำ

GBP/USD: แผนการซื้อขายสำหรับช่วงสหรัฐอเมริกาในวันที่ 7 พฤษภาคม (รีวิวการซื้อขายในช่วงเช้า)

ในการพยากรณ์ช่วงเช้าของฉัน ฉันได้มุ่งเน้นไปที่ระดับ 1.3335 และวางแผนการตัดสินใจเข้าเทรดโดยยึดตามจุดนี้ มาดูกราฟ 5 นาทีและดูกันว่าเกิดอะไรขึ้น การทะลุและการทดสอบระดับ 1.3335 นำไปสู่การเข้าเทรดขายในสกุลเงินปอนด์ แต่คู่เงินไม่สามารถแสดงการลดลงที่สำคัญได้ ภาพรวมทางเทคนิคถูกแก้ไขใหม่สำหรับครึ่งหลังของวัน วิธีเปิดสถานะซื้อระยะยาวบน GBP/USD: ข้อมูล

Miroslaw Bawulski 19:39 2025-05-07 UTC+2

EUR/USD: แผนการซื้อขายสำหรับช่วงการซื้อขายในสหรัฐฯ วันที่ 7 พฤษภาคม (รีวิวการซื้อขายในช่วงเช้า)

ในคำพยากรณ์ช่วงเช้าของฉัน ฉันได้เน้นไปที่ระดับ 1.1379 และวางแผนที่จะใช้ระดับนี้ในการตัดสินใจเข้าสู่ตลาด มาดูกราฟ 5 นาทีเพื่อทำความเข้าใจว่าเกิดอะไรขึ้น การเพิ่มขึ้นและการเกิด false breakout ใกล้ระดับ 1.1379 ได้เป็นสัญญาณให้เข้าสถานะขายสำหรับยูโร ซึ่งส่งผลให้คู่สกุลเงินนี้ลดลงมากกว่า

Miroslaw Bawulski 19:36 2025-05-07 UTC+2

วิธีการเทรดคู่สกุลเงิน GBP/USD ในวันที่ 7 พฤษภาคม? เคล็ดลับง่ายๆ และการวิเคราะห์การเทรดสำหรับผู้เริ่มต้น

คู่สกุลเงิน GBP/USD แสดงการเคลื่อนไหวขึ้นอย่างเด่นชัดในวันอังคาร แม้จะยังคงอยู่ภายในกรอบด้านข้างที่อาจไม่ได้ชัดเจนสำหรับเทรดเดอร์ทุกคนก็ตาม อย่างไรก็ตาม บนกรอบเวลา 1 ชั่วโมงที่ปรับขนาดลง มองเห็นได้ว่าราคาซื้อขายอยู่ระหว่าง 1.3203 และ 1.3440 นับตั้งแต่วันที่ 16 เมษายน

Paolo Greco 06:55 2025-05-07 UTC+2

วิธีการเทรดคู่เงิน EUR/USD ในวันที่ 7 พฤษภาคม? เคล็ดลับง่ายๆ และการวิเคราะห์การซื้อขายสำหรับผู้เริ่มต้น

ในวันอังคาร คู่สกุลเงิน EUR/USD มีการซื้อขายคงที่ตลอดทั้งวัน เนื่องจากไม่มีรายงานหรือเหตุการณ์สำคัญใดๆ ทั้งในยูโรโซนหรือในสหรัฐฯ จึงแทบจะไม่มีโอกาสที่การเคลื่อนที่ในลักษณะคงที่นี้จะสิ้นสุดลง ความหวังเดียวก็คือการที่ Donald Trump อาจแนะนำการจัดเก็บภาษีใหม่หรือทำการตัดสินใจที่ส่งผลกระทบสูง อย่างไรก็ตาม Trump ได้งดเว้นจากการทำให้ความขัดแย้งทางการค้าทวีความรุนแรงขึ้นตลอดช่วงสามสัปดาห์ที่ผ่านมา และขณะนี้กำลังมองหาวิธีการในการกดดันให้จีนและสหภาพยุโรปลงนามในข้อตกลงการค้าตามข้อกำหนดของเขา

Paolo Greco 06:55 2025-05-07 UTC+2

คำแนะนำและการวิเคราะห์การซื้อขายสำหรับ GBP/USD วันที่ 7 พฤษภาคม: พาวด์ไม่เสียเวลา

ในวันอังคาร คู่สกุลเงิน GBP/USD ได้กลับมาเคลื่อนไหวขึ้นอีกครั้งอย่างกะทันหันและไม่คาดคิด ในขณะที่เงินยูโรยังคงติดอยู่ในตลาดที่แบน แต่เงินปอนด์อังกฤษกลับแสดงการปรับตัวเพิ่มขึ้นอย่างแข็งแกร่ง และอีกครั้ง โดยไม่มีเหตุผลที่ชัดเจน ต้องย้ำว่าในช่วงต้นสัปดาห์นี้ Trump ได้กำหนดอัตราภาษีใหม่ต่ออุตสาหกรรมภาพยนตร์ ซึ่งเป็นเหตุผลพื้นฐานที่ทำให้ค่าเงินดอลลาร์ลดลง แต่เงินดอลลาร์กลับไม่ได้ลดค่าลงเมื่อเทียบกับเงินยูโร และการกำหนดอัตราภาษีเกิดขึ้นในวันจันทร์ ไม่ใช่วันอังคาร

Paolo Greco 03:35 2025-05-07 UTC+2

คำแนะนำและการวิเคราะห์การซื้อขาย EUR/USD วันที่ 7 พฤษภาคม: ตลาดยังคงซบเซา

คู่สกุลเงิน EUR/USD ยังคงเคลื่อนไหวอยู่ในช่วงแคบแบบซ้ายขวาในวันอังคาร ซึ่งเป็นช่วงแนวราบภายในแนวราบอีกชั้นหนึ่ง ช่วงแนวกว้างที่สุดถูกกำหนดโดยระดับ 1.1274 และ 1.1426 และช่วงที่แคบกว่าคือจาก 1.1274 ถึง 1.1370 ไม่ว่าจะมองยังไง ตลาดก็ยังคงเป็นตลาดแนวราบ และเราก็อยู่ในตลาดแบบนี้มาสักพักแล้ว

Paolo Greco 03:35 2025-05-07 UTC+2

GBP/USD: แผนการเทรดสำหรับรอบการซื้อขายในสหรัฐฯ วันที่ 6 พฤษภาคม (รีวิวการเทรดช่วงเช้า)

ในการคาดการณ์ของฉันในช่วงเช้า ฉันได้ให้ความสำคัญกับระดับ 1.3309 และวางแผนที่จะตัดสินใจเข้าตลาดโดยอิงตามระดับนี้ ลองมาดูที่กราฟ 5 นาทีและวิเคราะห์สิ่งที่เกิดขึ้น การเกิดขึ้นของการเบรกเอาท์หลอกที่ระดับ 1.3309 ให้จุดเข้าซื้อที่ดีสำหรับตำแหน่งซื้อส่งผลให้คู่สกุลเงินขึ้นมากกว่า 70 จุด ภาพทางเทคนิคถูกแก้ไขสำหรับช่วงบ่าย ข้อมูลดัชนีผู้จัดการฝ่ายจัดซื้อ (PMI)

Miroslaw Bawulski 18:52 2025-05-06 UTC+2

EUR/USD: แผนการซื้อขายสำหรับช่วงสหรัฐอเมริกาในวันที่ 6 พฤษภาคม (บทวิจารณ์การซื้อขายตอนเช้า)

ในคำพยากรณ์ช่วงเช้าของฉัน ฉันได้เน้นที่ระดับ 1.1346 และวางแผนที่จะตัดสินใจซื้อขายตามระดับนี้ มาดูที่กราฟ 5 นาทีและวิเคราะห์สิ่งที่เกิดขึ้น การขึ้นและการเกิดการเบรกเอาท์หลอกๆ รอบระดับ 1.1346 นำไปสู่จุดเข้าขายยูโร ทำให้คู่สกุลเงินนี้ลดลงถึงระดับ 1.1306 ส่วนภาพรวมทางเทคนิคไม่ได้รับการปรับในช่วงครึ่งหลังของวัน ข้อมูล

Miroslaw Bawulski 18:49 2025-05-06 UTC+2

จะเทรดคู่เงิน GBP/USD ในวันที่ 6 พฤษภาคมได้อย่างไร? เคล็ดลับง่ายๆ และการวิเคราะห์การเทรดสำหรับมือใหม่

ในวันจันทร์ คู่สกุลเงิน GBP/USD ยังคงซื้อขายในแนวข้างอย่างเคร่งครัด แม้ว่าเราไม่ได้เห็นกรอบแคบที่ชัดเจนสำหรับปอนด์ แต่ทิศทางยังคงเป็นแนวข้างมากกว่าแนวขึ้น ในช่วงแรกของวัน คู่สกุลเงินนี้มีการเพิ่มขึ้นเล็กน้อยจากข่าวการเก็บภาษีใหม่ของ Donald Trump จากนั้นร่วงลงหลังการประกาศดัชนี ISM ภาคบริการของสหรัฐฯ ในทั้งสองกรณี ความผันผวนยังต่ำ

Paolo Greco 05:40 2025-05-06 UTC+2

วิธีการเทรดคู่สกุลเงิน EUR/USD ในวันที่ 6 พฤษภาคม? เคล็ดลับง่าย ๆ และการวิเคราะห์การเทรดสำหรับผู้เริ่มต้น

ในวันจันทร์ คู่สกุลเงิน EUR/USD ซื้อขายทั้งขึ้นและลงอีกครั้ง ยืนยันถึงการมีอยู่ของตลาดที่คงที่ ราคาส่วนใหญ่เคลื่อนไหวอยู่ระหว่างระดับ 1.1275 และ 1.1424 มากว่าสามสัปดาห์แล้ว มันอยู่ใกล้ขอบล่างของช่องด้านข้าง ดังนั้นสามารถคาดหวังให้เกิดการกระเด้งกลับและการเคลื่อนไหวขาขึ้นใหม่ที่จะไม่ต้องการการสนับสนุนจากปัจจัยพื้นฐานหรือเศรษฐกิจมหภาค ในวันจันทร์ Donald Trump

Paolo Greco 05:40 2025-05-06 UTC+2
หากไม่สะดวกคุยในตอนนี้
ระบุคำถามไว้ได้ใน แชท.
Widget callback
 

Dear visitor,

Your IP address shows that you are currently located in the USA. If you are a resident of the United States, you are prohibited from using the services of InstaFintech Group including online trading, online transfers, deposit/withdrawal of funds, etc.

If you think you are seeing this message by mistake and your location is not the US, kindly proceed to the website. Otherwise, you must leave the website in order to comply with government restrictions.

Why does your IP address show your location as the USA?

  • - you are using a VPN provided by a hosting company based in the United States;
  • - your IP does not have proper WHOIS records;
  • - an error occurred in the WHOIS geolocation database.

Please confirm whether you are a US resident or not by clicking the relevant button below. If you choose the wrong option, being a US resident, you will not be able to open an account with InstaForex anyway.

We are sorry for any inconvenience caused by this message.