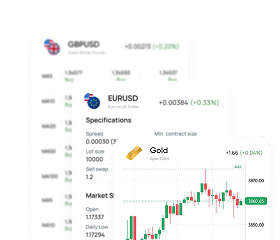
ส่วนนี้แสดงข้อมูลที่สำคัญที่สุดเกี่ยวกับการซื้อขายกับ InstaForex เราให้บริการทั้งการวิเคราะห์จากผู้เชี่ยวชาญชั้นนำสำหรับเทรดเดอร์ที่มีประสบการณ์และบทความเกี่ยวกับเงื่อนไขการซื้อขายสำหรับมือใหม่ บริการของเราจะช่วยเพิ่มศักยภาพในการทำกำไรของคุณ
อ่านเพิ่มเติม
ส่วนนี้ออกแบบมาสำหรับผู้ที่เพิ่งเริ่มต้นเส้นทางการซื้อขาย ข้อมูลการศึกษาและการวิเคราะห์ของ InstaForex จะตอบสนองความต้องการในการฝึกฝนของคุณ คำแนะนำจากผู้เชี่ยวชาญของเราจะทำให้คุณได้เดินก้าวแรกสู่ความสำเร็จในการซื้อขายที่ง่ายและโปร่งใส
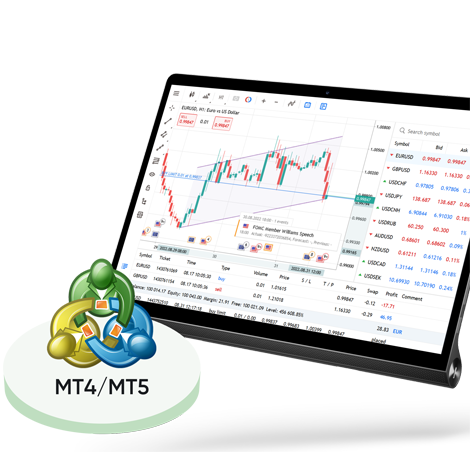
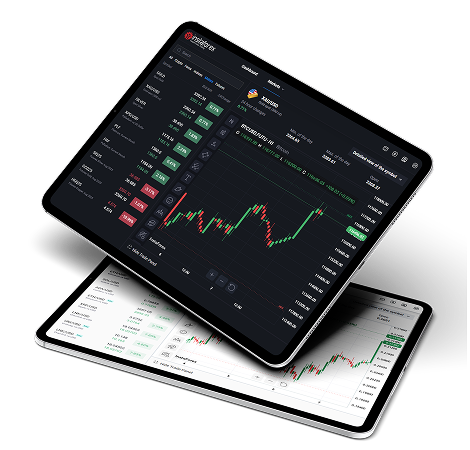
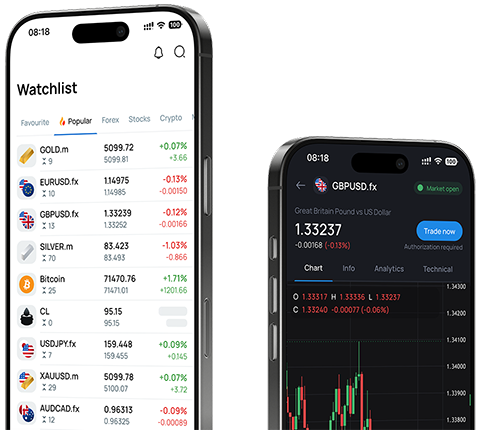
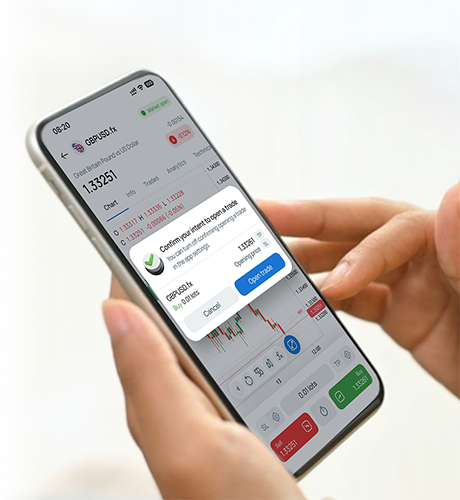
บริการที่เป็นนวัตกรรมของ InstaForex เป็นองค์ประกอบสำคัญของการลงทุนที่มีประสิทธิภาค เรามุ่งมั่นที่จะมอบความสามารถทางเทคนิคขั้นสูงให้กับลูกค้า และทำให้กิจวัตรการซื้อขายของพวกเขาสะดวกสบาย เนื่องจากเราได้รับการยอมรับว่าเป็นโบรกเกอร์ที่ดีที่สุดในเรื่องนี้
การเป็นพันธมิตรกับ InstaForex นั้นส่งผลดีและอยู่ในขั้นสูงสุด เข้าร่วมโปรแกรมพันธมิตรและเพลิดเพลินไปกับโบนัส รางวัลพันธมิตรและความเป็นไปได้ในการท่องเที่ยวกับทีมงานของแบรนด์ชื่อดังระดับโลก
ส่วนนี้ประกอบด้วยข้อเสนอที่ทำกำไรได้มากที่สุดจาก InstaForex เข้ารับโบนัสเมื่อเติมเงินในบัญชี แข่งขันกับเทรดเดอร์รายอื่น และรับรางวัลจริงแม้ในขณะที่ทำการซื้อขายในบัญชีเดโม่
วันหยุดกับทาง InstaForex ไม่เพียงแต่เป็นเรื่องน่ายินดี แต่ยังมีประโยชน์อีกด้วย เรามีพอร์ทัลแบบครบวงจร ฟอรัมมากมาย และบล็อกขององค์กร ซึ่งเทรดเดอร์สามารถแลกเปลี่ยนประสบการณ์และเข้าร่วมเข้ากับชุมชนฟอเร็กซ์ได้อย่างแน่นอน
InstaForex เป็นแบรนด์สากลที่ก่อตั้งในปี 2007 บริษัทให้บริการการซื้อขาย FX ออนไลน์และถือเป็นหนึ่งในโบรกเอร์ชั้นนำของโลก ทางเราได้รับความไว้วางใจจากเทรดเดอร์รายย่อยกว่า 7,000,000 คนที่ประทับใจในความน่าเชื่อถือของเราและโฟกัสในนวัตกรรม