empty
19.10.2021 08:31 AM
EUR/USD: plan for the European session on October 19. COT reports. Euro bulls have taken 1.1637 and are aiming for new monthly highs

To open long positions on EUR/USD, you need:

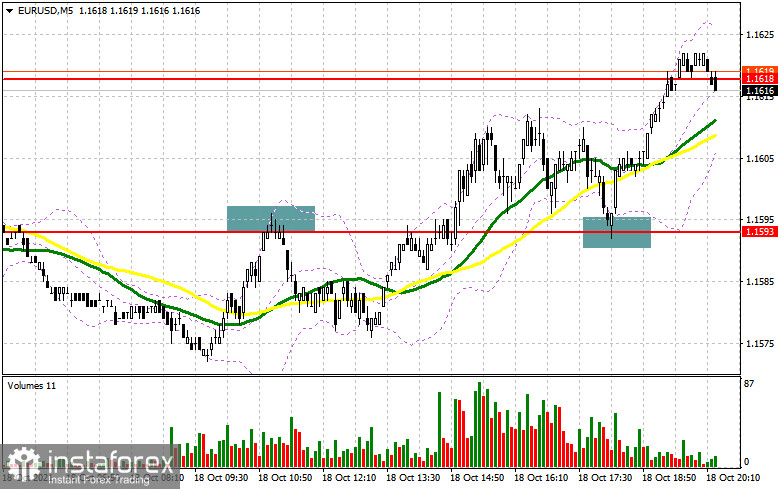
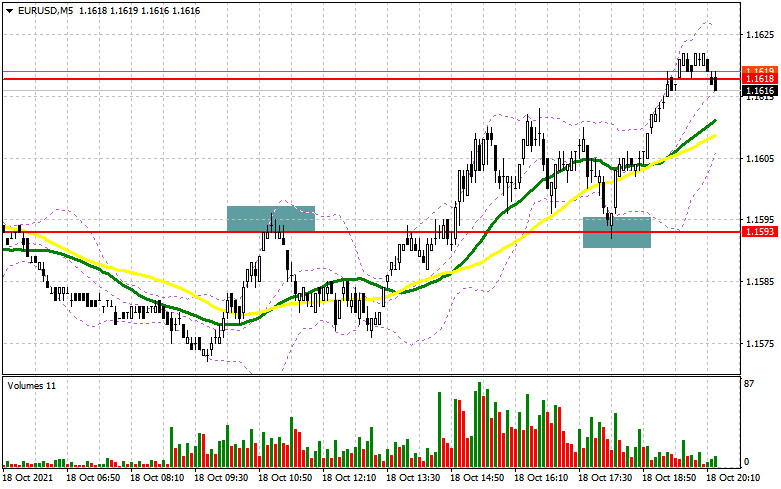
Several interesting signals to enter the market were formed yesterday. Let's take a look at the 5 minute chart and break down the entry points. In the first half of the day I paid attention to the level 1.1593 and recommended making decisions from it. It is clearly seen how the formation of a false breakout and an unsuccessful attempt to break through the level of 1.1593 leads to creating a signal to sell the euro, after which the pair falls by about 20 points. Considering the low volatility in the first half of the day, the movement amounted to 2/3 of it. During the US session, amid weak data on industrial production in the US, the euro bulls managed to recapture the level of 1.1593, and a reverse test of this range leads to forming a buy signal. As a result, one could observe an active recovery of the pair to the resistance area of 1.1618.

Before talking about the further prospects for the EUR/USD movement, let's see what happened in the futures market and how the Commitment of Traders positions have changed. The Commitment of Traders (COT) report for October 12 revealed an increase in both short and long positions, but there were more of the former, which slightly reduced the negative delta. Political problems in the United States of America have been resolved, and the latest fundamental reports continue to delight traders, which testifies to the continued good pace of the American economic recovery. The fact that the Federal Reserve is already seriously considering scrapping the bond buying program is no longer news that could help dollar bulls at the moment. But the fact that representatives of the European Central Bank began to express concern about the rate of inflation, albeit not in the same form as their colleagues from the Fed - all this allows the European currency to begin to gradually win back its positions. This trend may continue in the future, especially in the case of strong statistics on the European economy. However, the larger medium-term demand for risky assets will remain limited due to the wait-and-see attitude of the ECB. The COT report indicated that long non-commercial positions rose from 196,819 to 202,512, while short non-commercial positions jumped from 219,153 to 220,910. By the end of the week, the total non-commercial net position rose slightly to -18 398 against -22,334. The weekly closing price dropped to 1.1553 against 1.1616.

This image is no longer relevant

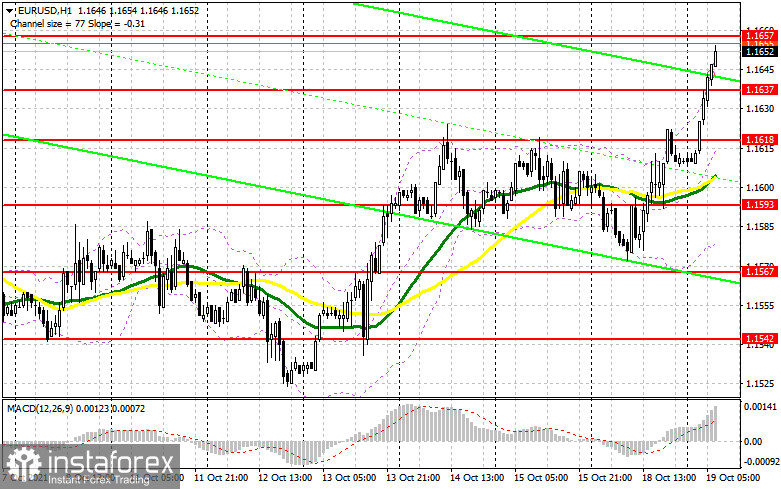
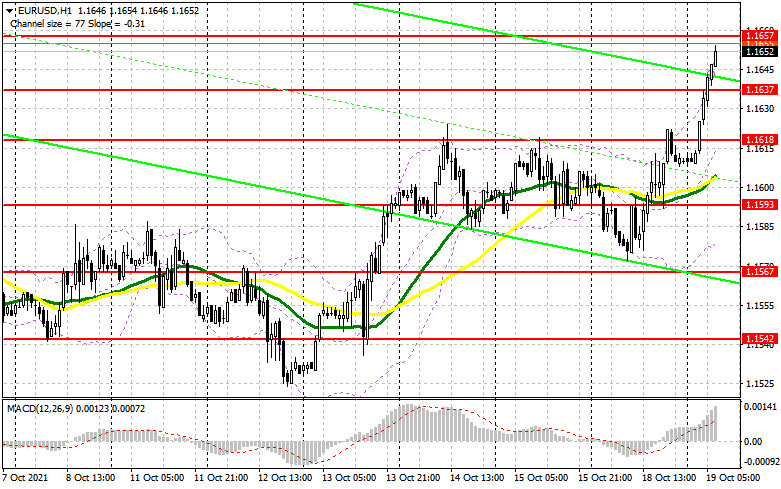
The euro has risen sharply during the Asian session and is aimed at renewing new monthly highs. Speeches by representatives of the ECB, namely: Frank Elderson and ECB executive board member Fabio Panetta, may lead to more active long positions of the euro in the morning. The initial target of the bulls is a breakthrough of the level 1.1657, which they came close to after the Asian rally. Only a breakthrough and test of this area from top to bottom forms a new signal to open long positions in hopes of further growth of the pair and the continuation of the upward trend to the 1.1684 area. A breakthrough of this range with a similar consolidation forms an additional entry point to buy, which will lead EUR/USD to new local levels: 1.1713 and 1.1742, where I recommend taking profits. A better option for buying would be a downward correction in the first half of the day to the support area at 1.1637. Forming a false breakout there will be an excellent signal to open long positions during the morning growth. I advise you to buy EUR/USD immediately on a rebound only after the first test of the 1.1618 low, or even lower - from the level of 1.1593, counting on an upward rebound of 15-20 points within the day.

To open short positions on EUR/USD, you need:

After yesterday's unsuccessful reversal of the bullish trend, bears are no longer in a hurry to return to the market. The absence of fundamental reports on the eurozone today may further worsen their situation. The original goal is to protect the resistance at 1.1657. Forming a false breakout there will be the first signal to open short positions, which will give an excellent point to the market with the goal of pulling the pair down to the intermediate support of 1.1637. A breakthrough and a test of this area from the bottom up will increase the pressure on the pair and open the way to the lows: 1.1618 and 1.1593, where the moving averages, playing on the side of the bulls, pass. I recommend taking profits on short positions there. In case the euro grows further during the European session and the bears are not active around 1.1657, I advise you to postpone shorts until the next resistance test at 1.1684. But even there, it is best to open short positions after the formation of a false breakout. The best option for selling EUR/USD immediately on a rebound will be new highs in the area of 1.1713 and 1.1742, and then, counting on a downward correction of 15-20 points.

This image is no longer relevant

I recommend that you familiarize yourself with:

GBP/USD: plan for the European session on October 19. COT reports. Pound bulls have defended 1.3717 and are aiming for new weekly highs

Indicator signals:

Moving averages

Trading is carried out above 30 and 50 moving averages, which indicates a continuation of the upward trend in the euro.

Note: The period and prices of moving averages are considered by the author on the H1 hourly chart and differs from the general definition of the classic daily moving averages on the daily D1 chart.

Bollinger Bands

In case of a decline, the indicator's average border in the area of 1.1618 will act as a support.

Description of indicators

  • Moving average (moving average, determines the current trend by smoothing out volatility and noise). Period 50. It is marked in yellow on the chart.
  • Moving average (moving average, determines the current trend by smoothing out volatility and noise). Period 30. It is marked in green on the chart.
  • MACD indicator (Moving Average Convergence/Divergence — convergence/divergence of moving averages) Quick EMA period 12. Slow EMA period to 26. SMA period 9
  • Bollinger Bands (Bollinger Bands). Period 20
  • Non-commercial speculative traders, such as individual traders, hedge funds, and large institutions that use the futures market for speculative purposes and meet certain requirements.
  • Long non-commercial positions represent the total long open position of non-commercial traders.
  • Short non-commercial positions represent the total short open position of non-commercial traders.
  • Total non-commercial net position is the difference between short and long positions of non-commercial traders.
เลือกช่วงเวลา
5
นาที
15
นาที
30
นาที
1
ชั่วโมง
4
ชั่วโมง
1
วัน
1
สัปดาห์
รับผลกำไรจากการเปลี่ยนแปลงอัตราสกุลเงินดิจิทัลกับ InstaForex.
ดาวน์โหลด MetaTrader 4 และเปิดการซื้อขายครั้งแรกของคุณ.
สงครามการค้าเป็นส่วนหนึ่งของการเผชิญหน้าระดับโลก หลายคนอาจเชื่อว่าสงครามการค้าซึ่งริเริ่มโดยโดนัลด์ ทรัมป์ เป็นเพียงเครื่องมือในการลดการขาดดุลงบประมาณและหนี้สาธารณะ อย่างไรก็ตาม เมื่อเราพิจารณาอย่างใกล้ชิดจะเห็นได้ว่านี่เป็นเพียงส่วนหนึ่งของการเผชิญหน้าระดับโลกที่กว้างขวางกว่านั้น ระหว่างจีนและสหรัฐอเมริกา สองมหาอำนาจนี้ยังคงแข่งขันเพื่อการครอบครองและเป็นผู้นำในระดับโลก การทำให้อีกฝ่ายอ่อนแอลงจึงเป็นส่วนหนึ่งของกลยุทธ์ของรัฐบาล ในขณะที่ไม่มีการยกระดับที่สำคัญภายใต้การนำที่สงบสุขของโจ ไบเดน แต่ภายใต้ทรัมป์ที่เคยปะทะกับจีนอย่างเปิดเผยเมื่อแปดปีที่แล้ว ชะตากรรมของความขัดแย้งนี้แทบจะถูกกำหนดไว้ล่วงหน้าแล้ว เมื่อเร็ว ๆ นี้
  • Grand Choice
    Contest by
    InstaForex
    InstaForex always strives to help you
    fulfill your biggest dreams.
    เข้าร่วมการแข่งขัน


บทความแนะนำ

GBP/USD: แผนการเทรดสำหรับรอบการซื้อขายในสหรัฐฯ วันที่ 6 พฤษภาคม (รีวิวการเทรดช่วงเช้า)

ในการคาดการณ์ของฉันในช่วงเช้า ฉันได้ให้ความสำคัญกับระดับ 1.3309 และวางแผนที่จะตัดสินใจเข้าตลาดโดยอิงตามระดับนี้ ลองมาดูที่กราฟ 5 นาทีและวิเคราะห์สิ่งที่เกิดขึ้น การเกิดขึ้นของการเบรกเอาท์หลอกที่ระดับ 1.3309 ให้จุดเข้าซื้อที่ดีสำหรับตำแหน่งซื้อส่งผลให้คู่สกุลเงินขึ้นมากกว่า 70 จุด ภาพทางเทคนิคถูกแก้ไขสำหรับช่วงบ่าย ข้อมูลดัชนีผู้จัดการฝ่ายจัดซื้อ (PMI)

Miroslaw Bawulski 18:52 2025-05-06 UTC+2

EUR/USD: แผนการซื้อขายสำหรับช่วงสหรัฐอเมริกาในวันที่ 6 พฤษภาคม (บทวิจารณ์การซื้อขายตอนเช้า)

ในคำพยากรณ์ช่วงเช้าของฉัน ฉันได้เน้นที่ระดับ 1.1346 และวางแผนที่จะตัดสินใจซื้อขายตามระดับนี้ มาดูที่กราฟ 5 นาทีและวิเคราะห์สิ่งที่เกิดขึ้น การขึ้นและการเกิดการเบรกเอาท์หลอกๆ รอบระดับ 1.1346 นำไปสู่จุดเข้าขายยูโร ทำให้คู่สกุลเงินนี้ลดลงถึงระดับ 1.1306 ส่วนภาพรวมทางเทคนิคไม่ได้รับการปรับในช่วงครึ่งหลังของวัน ข้อมูล

Miroslaw Bawulski 18:49 2025-05-06 UTC+2

จะเทรดคู่เงิน GBP/USD ในวันที่ 6 พฤษภาคมได้อย่างไร? เคล็ดลับง่ายๆ และการวิเคราะห์การเทรดสำหรับมือใหม่

ในวันจันทร์ คู่สกุลเงิน GBP/USD ยังคงซื้อขายในแนวข้างอย่างเคร่งครัด แม้ว่าเราไม่ได้เห็นกรอบแคบที่ชัดเจนสำหรับปอนด์ แต่ทิศทางยังคงเป็นแนวข้างมากกว่าแนวขึ้น ในช่วงแรกของวัน คู่สกุลเงินนี้มีการเพิ่มขึ้นเล็กน้อยจากข่าวการเก็บภาษีใหม่ของ Donald Trump จากนั้นร่วงลงหลังการประกาศดัชนี ISM ภาคบริการของสหรัฐฯ ในทั้งสองกรณี ความผันผวนยังต่ำ

Paolo Greco 05:40 2025-05-06 UTC+2

วิธีการเทรดคู่สกุลเงิน EUR/USD ในวันที่ 6 พฤษภาคม? เคล็ดลับง่าย ๆ และการวิเคราะห์การเทรดสำหรับผู้เริ่มต้น

ในวันจันทร์ คู่สกุลเงิน EUR/USD ซื้อขายทั้งขึ้นและลงอีกครั้ง ยืนยันถึงการมีอยู่ของตลาดที่คงที่ ราคาส่วนใหญ่เคลื่อนไหวอยู่ระหว่างระดับ 1.1275 และ 1.1424 มากว่าสามสัปดาห์แล้ว มันอยู่ใกล้ขอบล่างของช่องด้านข้าง ดังนั้นสามารถคาดหวังให้เกิดการกระเด้งกลับและการเคลื่อนไหวขาขึ้นใหม่ที่จะไม่ต้องการการสนับสนุนจากปัจจัยพื้นฐานหรือเศรษฐกิจมหภาค ในวันจันทร์ Donald Trump

Paolo Greco 05:40 2025-05-06 UTC+2

คำแนะนำการซื้อขายและการวิเคราะห์สำหรับ GBP/USD เมื่อวันที่ 6 พฤษภาคม: ทรัมป์ vs. ISM

ในวันจันทร์ คู่สกุลเงิน GBP/USD ตั้งใจที่จะเริ่มคลื่นใหม่ของแนวโน้มขาขึ้นซึ่งดำเนินมายาวนานหลายเดือน อย่างไรก็ตาม ในช่วงบ่าย ตลาดตอบสนองอย่างไม่คาดคิดต่อรายงาน U.S. ISM Services PMI ทำให้ค่าเงินดอลลาร์ปรับปรุงสถานะภายในวันได้เล็กน้อย แน่นอนว่าไม่มีการเพิ่มขึ้นอย่างมีนัยสำคัญในค่าเงินดอลลาร์สหรัฐ ต้องไม่ลืมว่ารายงาน

Paolo Greco 03:32 2025-05-06 UTC+2

คำแนะนำและวิเคราะห์เกี่ยวกับการซื้อขาย EUR/USD ประจำวันที่ 6 พฤษภาคม: น่าประหลาดใจและเหลือเชื่อ

ในวันจันทร์ คู่สกุลเงิน EUR/USD กลับมาทำกิจกรรมที่ชื่นชอบได้ทันทีตั้งแต่เช้า นั่นคือการเคลื่อนไหวขึ้นไปทางเหนือ มีการเปิดเผยว่า หลังจากหยุดไปสามสัปดาห์ Donald Trump ตัดสินใจนำนโยบายใหม่มาสู่ตลาดโดยการเรียกเก็บภาษีใหม่ คราวนี้ไม่เจาะจงที่อุตสาหกรรมหรือประเทศใด แต่เล็งไปที่อุตสาหกรรมภาพยนตร์ Trump ได้กล่าวว่า ศิลปะก็ไม่ต่างจากการผลิตรถยนต์

Paolo Greco 03:32 2025-05-06 UTC+2

GBP/USD: แผนการซื้อขายสำหรับช่วงสหรัฐอเมริกาวันที่ 5 พฤษภาคม (รีวิวการซื้อขายในช่วงเช้า)

ในบทวิเคราะห์ช่วงเช้า ผมได้เน้นไปที่ระดับ 1.3324 และวางแผนการตัดสินใจซื้อขายโดยพิจารณาจากระดับนี้ มาดูกราฟ 5 นาทีและวิเคราะห์สิ่งที่เกิดขึ้น การเพิ่มขึ้นและการเกิดการฝ่าทะลวงเทียมที่ระดับ 1.3324 สร้างจุดเข้าที่ดีสำหรับการทำกำไรจากตำแหน่งสั้น แต่การลดลงอย่างมีนัยสำคัญในคู่สกุลเงินนี้ไม่ได้ตามมา มุมมองทางเทคนิคนั้นได้รับการปรับปรุงสำหรับครึ่งวันที่เหลือ การเปิดสถานะ Long

Miroslaw Bawulski 17:52 2025-05-05 UTC+2

EUR/USD: กรอบการเทรดสำหรับเซสชั่นของสหรัฐในวันที่ 5 พฤษภาคม (บทวิจารณ์การเทรดช่วงเช้า)

ในการคาดการณ์ช่วงเช้าของฉัน ฉันได้เน้นที่ระดับ 1.1346 และวางแผนที่จะตัดสินใจซื้อขายตามระดับนี้ ลองดูกราฟ 5 นาทีและดูว่าเกิดอะไรขึ้น การฝ่าและทดสอบซ้ำที่ 1.1346 ได้นำไปสู่จุดเข้าซื้อสำหรับยูโร แต่จนถึงตอนนี้ การปรับขึ้นครั้งใหญ่ยังไม่เกิดขึ้น ภาพทางเทคนิคไม่ได้ถูกปรับปรุงใหม่สำหรับช่วงครึ่งหลังของวัน การเปิดสถานะซื้อ (Long

Miroslaw Bawulski 17:48 2025-05-05 UTC+2

แนวคิดการซื้อขาย: การร่วงของ EUR/USD

สวัสดีครับ/ค่ะ เหล่านักเทรดทั้งหลาย! วันนี้ผมจะมานำเสนอไอเดียการเทรดสำหรับ EUR/USD ครับ/ค่ะ หลังจากแรงขายที่หนักหน่วงในวันศุกร์ เครื่องมือทางการเงินนี้ได้เข้าสู่ช่วงการปรับตัวขึ้น และขณะนี้กำลังทดสอบโซนที่แตกออก ซึ่งอาจทำหน้าที่เป็นจุดต่อเนื่องของแนวโน้มขาลง ฉันขอแนะนำให้พิจารณาการเปิดสถานะขายจากการดีดตัวกลับไปที่โซนการฝ่าแนวรับ ตามแผนที่แสดงในชาร์ตข้างต้น ความเสี่ยงควรถูกจำกัดที่ 1.13800 และควรทำกำไรเมื่อมีการฝ่าแนวรับต่ำกว่า 1.12642

Andrey Shevchenko 08:55 2025-05-05 UTC+2

แนวคิดการซื้อขายสำหรับ GBP/USD ที่จะลดลง

สวัสดีครับ เทรดเดอร์ทุกท่าน! ผมมีแนวคิดการซื้อขายสำหรับ GBP/USD มานำเสนอครับ หลังจากที่มีการรุกเข้าสู่ภาวะขาลงอย่างหนักในวันศุกร์ เครื่องมือนี้ได้เข้าสู่การขยับขึ้นเพื่อแก้ไข และขณะนี้กำลังทดสอบพื้นที่การร่วงลงสั้นๆ ซึ่งอาจเป็นจุดเริ่มต้นสำหรับการดำเนินแนวโน้มขาลงต่อไป ผมแนะนำให้พิจารณาเปิดสถานะขาย (short positions) เมื่อราคาย้อนกลับไปยังจุดที่ราคาทะลุผ่าน โดยพิจารณาจากการตั้งค่าที่แสดงในกราฟด้านบน จำกัดความเสี่ยงที่ระดับ

Andrey Shevchenko 08:55 2025-05-05 UTC+2
หากไม่สะดวกคุยในตอนนี้
ระบุคำถามไว้ได้ใน แชท.
Widget callback
 

Dear visitor,

Your IP address shows that you are currently located in the USA. If you are a resident of the United States, you are prohibited from using the services of InstaFintech Group including online trading, online transfers, deposit/withdrawal of funds, etc.

If you think you are seeing this message by mistake and your location is not the US, kindly proceed to the website. Otherwise, you must leave the website in order to comply with government restrictions.

Why does your IP address show your location as the USA?

  • - you are using a VPN provided by a hosting company based in the United States;
  • - your IP does not have proper WHOIS records;
  • - an error occurred in the WHOIS geolocation database.

Please confirm whether you are a US resident or not by clicking the relevant button below. If you choose the wrong option, being a US resident, you will not be able to open an account with InstaForex anyway.

We are sorry for any inconvenience caused by this message.