empty
02.12.2020 05:31 PM
EUR/USD may reach new highs

The US Congress' efforts to take additional measures to combat the effects of the coronavirus pandemic have led to new disagreements. Yesterday, Democrats and Republicans released a document that considers stimulus measures worth $908 billion. At first, everyone supported the idea, and both parties came to an agreement. However, there were those who opposed these measures. That is why the document will hardly be passed by Congress.

The House of Representatives controlled by the Democratic party and the Senate controlled by Republicans are still arguing about the size of the stimulus package. Democrats suppose that it should exceed $2 trillion, whereas their opponents are insisting on $500 billion.

Discussions of new stimulus measures should have encouraged trades. However, the disagreement is leading to the US dollar sell-off and may even cause a slowdown in the economic recovery.

At the same time, Federal Reserve Governor Jerome Powell and Treasury Secretary Steven Mnuchin supported additional stimulus measures which may allow the country to overcome difficulties caused by the pandemic.

The coronavirus crisis could be worse than the Great Recession for companies that had high debt levels at the beginning of the outbreak, according to an economist at the Federal Reserve Bank of New York.

Organizations in the industries most affected by the pandemic, such as tourism, travel, and hospitality, could grow 10% slower than normal if the current crisis worsens to the 2007-2009 economic downturn.

As we can see investors have a lot of reasons for concern. The recent sell-off of the US dollar proves this fact.

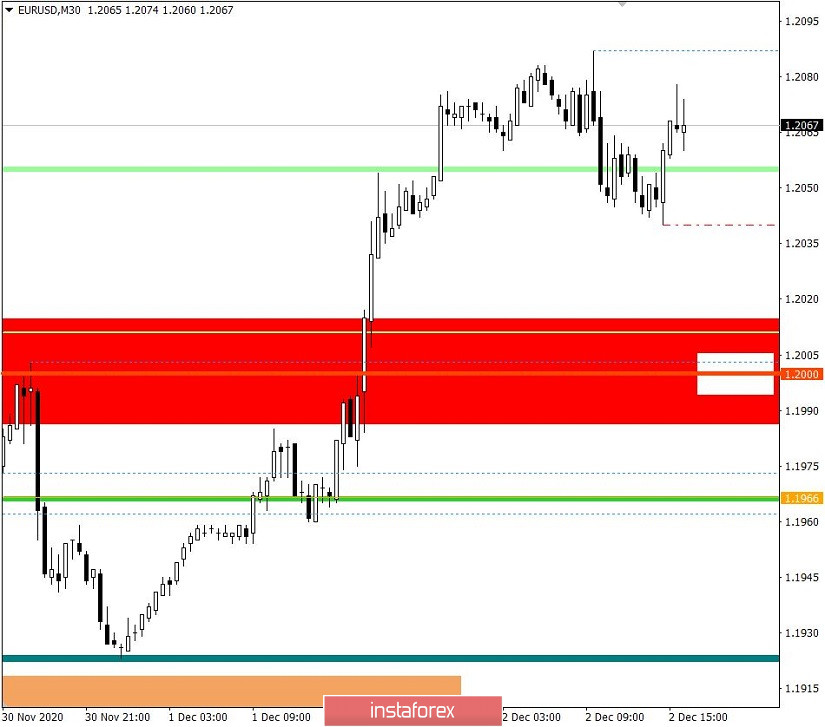
According to the technical analysis, we can see the first significant change in the market in the last four months. The euro/dollar pair changed the structure of a long-lived sideways channel and broke the psychological level of 1.2000.

This, in turn, resulted in the resumption of a mid-term uptrend. The quote immediately reached the levels logged in spring 2018.

If the price consolidates above 1.2000, it may jump even higher despite the fact that the euro is overbought.

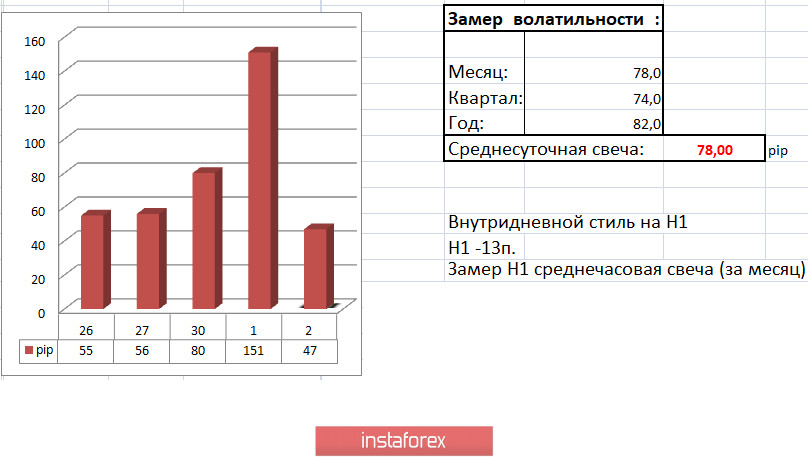
On December 1, the market dynamic totaled 151 pips. It is the highest daily volatility in the last 19 trading days. The coefficient of speculative operations reached quite a high level. This was proved by the impulse move.

On the daily chart, we can see that the mid-term tendency, which appeared this spring, reached 1,400 pips (+13.4%).

This image is no longer relevant

Today, the eurozone reported on its unemployment rate. The data surprised market participants. Economists had forecast a further rise to 8.5% from 8.3%. However, the previous data was revised. It turned out that the eurozone labor market is recovering. Thus, the unemployment rate dropped from 8.5% from 8.4%.

During the US trading session, the ADP non-farm employment change data was disclosed. Analysts had expected an advance of 410 thousand compared to the rise of 364 thousand in the previous period. However, the indicator climbed just by 307 thousand.

However, markets showed no reaction to the data. It is quite possible that news about Brexit is exerting pressure on traders. In fact, the news has already influenced the pound sterling.

On the trading chart, we can see that the quote is hovering within the levels of 1.2040/1.2085. Economists expected that after the recent rally, the pair would slide to 1.2000.

If the quote fixes below 1.2040, it may drop to 1.2000. Otherwise, the pair will continue trading within the mentioned levels. In this case, the trading strategy will be based on a break of the range.
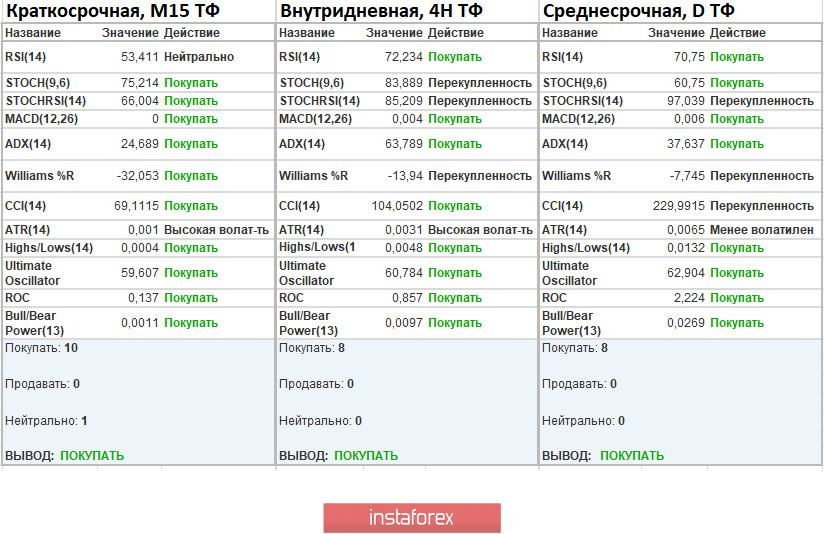
This image is no longer relevant

Indicator analysis

Analyzing various time frames, we can see that technical indicators on a minute, one-hour, and daily time frames point to buy signals. That is why quotes reached new local highs.

This image is no longer relevant

Volatility for the week/Measurement of volatility: month, quarter, year

The volatility measurement reflects the average daily fluctuation calculated for a month/quarter/year.

At the moment, the market dynamic is 47 pips. It is a rather low reading. However, after the recent rally, a local slowdown is quite possible.

This image is no longer relevant

Key levels

Resistance levels: 1.2100*; 1.2450**; 1.2550; 1.2825.

Support levels: 1.2000***; 1.1890-1.1900-1.1920**; 1.1810*; 1.1700; 1.1612*;1.1500; 1.1350.

* Periodic level

** Range level

***Psychological level

เลือกช่วงเวลา
5
นาที
15
นาที
30
นาที
1
ชั่วโมง
4
ชั่วโมง
1
วัน
1
สัปดาห์
รับผลกำไรจากการเปลี่ยนแปลงอัตราสกุลเงินดิจิทัลกับ InstaForex.
ดาวน์โหลด MetaTrader 4 และเปิดการซื้อขายครั้งแรกของคุณ.
การวิเคราะห์ EUR/USD - 31 มีนาคม โครงสร้างคลื่นบนแผนภูมิ 4 ชั่วโมงของ EUR/USD กำลังมีความเสี่ยงที่จะเปลี่ยนรูปร่างเป็นรูปแบบที่ซับซ้อนยิ่งขึ้น ในวันที่ 25 กันยายนปีที่ผ่านมา โครงสร้างลดลงใหม่เริ่มที่จะการสร้างและอยู่ในรูปแบบของลัพธ์คลื่นห้า สามเดือนที่ผ่านมา โครงสร้างแก้ไขขึ้นเริ่มที่จะการสร้างในที่ควรจะประกอบด้วยคลื่นอย่างน้อยสามคลื่น โครงสร้างของคลื่อแรกถูกสร้างขึ้นอย่างดีและจึงทำให้ฉันคาดว่าคลื่นที่สองจะต้องมีรูปร่างที่ชัดเจนเช่นเดียวกัน อย่างไรก็ตาม ขนาดของคลื่นนี้ใหญ่มากจนเป็นอันตรายถ้ามันเปลี่ยนรูปแบบคลื่นอย่างมาก ข่าวสารที่ส่งออกมายังคงสนับสนุนผู้ขายมากกว่าผู้ซื้อเมื่อมาถึงข้อมูลทางเศรษฐกิจ
  • Grand Choice
    Contest by
    InstaForex
    InstaForex always strives to help you
    fulfill your biggest dreams.
    เข้าร่วมการแข่งขัน


บทความแนะนำ

สัญญาณการเทรดสำหรับ GOLD (XAU/USD) วันที่ 23-25 กรกฎาคม 2024: ซื้อเมื่อราคาสูงกว่า $2,389 (ดีดตัว - 5/8 Murray)

ราคาทองคำซื้อขายอยู่ที่ประมาณ 2,402.86 ซึ่งต่ำกว่าช่องทิศทางขาลงที่ก่อตัวขึ้นตั้งแต่วันที่ 17 กรกฎาคม และภายในช่องขาขึ้นที่ก่อตัวขึ้นหลังจากแตะจุดต่ำที่ 2,384 ทองคำยังคงอยู่ภายใต้แรงกดดันการขายและต่ำกว่าเส้นค่าเฉลี่ยเคลื่อนที่ 21 วัน (21 SMA) ที่อยู่ที่ระดับ 2,412 มีโอกาสที่จะเกิดการปรับทางเทคนิคและราคาทองคำอาจลงไปถึงระดับ

Dimitrios Zappas 17:01 2024-07-23 UTC+2

GBP/USD: เคล็ดลับการเทรดสำหรับผู้เริ่มต้นในช่วงตลาดยุโรปวันที่ 25 มิถุนายน

การทดสอบราคา 1.2672 เกิดขึ้นเมื่อดัชนี MACD เพิ่งเริ่มเพิ่มขึ้นจากจุดศูนย์ ซึ่งยืนยันจุดเข้าซื้อที่ถูกต้องในการซื้อปอนด์ เป็นผลให้คู่สกุลเงิน GBP/USD เพิ่มขึ้นมากกว่า 30 จุด สิ่งนี้เกิดขึ้นในช่วงที่ไม่มีข้อมูลสำคัญจากสหราชอาณาจักร ทำให้ผู้ซื้อมีโอกาสที่จะปรับแก้สูงขึ้นในช่วงต้นสัปดาห์ วันนี้ ปฏิทินเศรษฐกิจแทบจะว่างเปล่าอีกครั้ง

Jakub Novak 09:11 2024-06-25 UTC+2

การวิเคราะห์และเคล็ดลับการซื้อขายสำหรับ GBP/USD ในวันที่ 15 เมษายน

การวิเคราะห์การซื้อขายและเคล็ดลับสำหรับการซื้อขาย GBP/USD การลดลงต่อไปจะถูก จำกัด เนื่องจากการทดสอบที่ 1.2477 เกิดขึ้นในขณะที่เส้น MACD ขยับลงมาอย่างเข้มข้นจากศูนย์ การซื้อที่ระงับที่ 1.2434 ในทางตรงกันกับนี้ ได้นำไปสู่การเพิ่มราคา 20 pips

Jakub Novak 09:10 2024-04-15 UTC+2

สรุปรายสัปดาห์เกี่ยวกับ GBP/USD ในวันที่ 26-30 พฤศจิกายน พ.ศ. 2566

บทวิจารณ์: ราคาปัจจุบันถูกกำหนดไว้ที่ระดับ 1.2423 ซึ่งเป็นจุดพิวต์รอบรอบรายวันที่เห็นได้ที่ 1.2434 สำคัญอย่างเท่าเทียมกันคือราคาอยู่ในช่องโฆษณาที่ใดมากขึ้น ตามเหตุการณ์ก่อนหน้านี้ เราคาดหวังคู่สกุลเงิน GBP/USD จะเคลื่อนย้ายระหว่าง 1.2495 และ 1.2603 ซึ่งจะแสดงให้เห็นถึงการตลาดตลาดที่มีแนวโน้มขึ้น เนื่องจากตัวบ่งชี้

Mourad El Keddani 18:57 2023-11-26 UTC+2

บทสรุปรายสัปดาห์เกี่ยวกับ EUR/USD ในวันที่ 26-30 พฤศจิกายน พ.ศ. 2566

บทวิจารณ์ : แนวโน้มของคู่สกุล EUR/USD อาจมีความขัดแย้งเนื่องจากการเคลื่อนไหวอยู่ในช่องลงตลิ่ง ด้วยเหตุการณ์ที่ผ่านมา ราคายังคงอยู่ระหว่างระดับ 1.0850 และ 1.0773 ดังนั้น แนะนำให้ระวังพฤติกรรมการซื้อขายในระดับเหล่านี้ เนื่องจากราคาของ 1.0850

Mourad El Keddani 18:45 2023-11-26 UTC+2

บทสรุปรายสัปดาห์สำหรับ GBP/USD ในช่วงวันที่ 20-24 พฤศจิกายน 2023

บทวิจารณ์ : เครื่องปรับความเสี่ยงของคู่สกุลเงิน GBP/USD มีการเคลื่อนไหวอย่างไม่แน่นอนเนื่องจากมีการเกิดขึ้นในช่องแนวคลาดเอียงลง. เนื่องจากเหตุการณ์ก่อนหน้านี้ ราคายังคงอยู่ระหว่างระดับ 1.2291 และ 1.2153 ดังนั้นแนะนำให้ระมัดระวังในการดำเนินการในระดับเหล่านี้ เนื่องจากราคา 1.2291 และ 1.2153

Mourad El Keddani 19:45 2023-11-20 UTC+2

การตรวจทานอัตราแลกเปลี่ยนของ EUR/USD ในสัปดาห์ที่ 20-24 พฤศจิกายน ค.ศ. 2023

บทวิจารณ์ : แนวโน้มของคู่สกุล EUR/USD มีจุดโต้แย้งเนื่องจากมีการซื้อขายอยู่ในช่วงแนวด้านข้างแคบ ทำให้ตลาดแสดงเครื่องสัญญาณของความไม่มั่นคง ในขณะที่เหตุการณ์ก่อนหน้านี้ ราคายังคงเคลื่อนไหวระหว่างระดับ 1.0534 และ 1.0780 ความต้านทานและการสนับสนุนเห็นได้ที่ระดับ 1.0780 (นอกจากนี้ขายที่มีครึ่งบนก็ถูกตั้งที่จุดที่ 1.0780)

Mourad El Keddani 19:34 2023-11-20 UTC+2

Weekly review วันที่ 11 พฤศจิกายน 2023 ใน GBP/USD

บทสรุปสัปดาห์ : เป็นไปได้อย่างรวดเร็วที่จะรีเซ็ตเป็นแนวโน้มเป็นกลางหรือแนวโน้มตลาดเป็นตลาดที่เหนียวเพื่อหลีกเลี่ยงการขัดแย้งในระยะสั้น จึงจะเป็นไปได้ที่จะตั้งค่าตำแหน่งสั้น (สำหรับการขาย) สำหรับคู่สกุลเงิน GBP/USD ในระยะเวลาที่ราคายังคงอยู่ต่ำกว่าระดับ 1.2271 หากจำเป็น จุดเป้าหมายสำหรับการขายคู่สกุลเงินนี้คือ 1.2220 ดอลลาร์สหรัฐฯ ประสบการณ์การย่อยจากทุกทั้งเหล่านั้นกับการปรับบวกในตลาด เครื่องหมายโปร่งใสที่

Mourad El Keddani 19:48 2023-11-11 UTC+2

อีวีด้อย รีวิวเกี่ยวกับ EUR/USD ในวันที่ 11 พฤศจิกายน พ.ศ. 2566

สรุปรายสัปดาห์ : แนวโน้มของการเคลื่อนไหวของคู่สกุล EUR/USD มีความขัดแย้ง เนื่องจากมีการเคลื่อนไหวในช่องลงตัวโน้มตลาด จากเหตุการณ์ก่อนหน้านี้ราคายังคงถูกกำหนดอยู่ระหว่างระดับที่ 1.0850 และ 1.0773 ดังนั้น ขอแนะนำให้ระมัดระวังในการทำสัญญาในระดับเหล่านี้ เนื่องจากราคา 1.0850

Mourad El Keddani 19:41 2023-11-11 UTC+2

บทวิจารณ์รายสัปดาห์เกี่ยวกับ EUR/USD สำหรับวันที่ 30-31 ตุลาคม 2023

บทสรุปรายสัปดาห์: คู่ EUR/USD ได้โดนจุดพิวเตอร์สัปดาห์และเส้นความต้านทานระดับ 1 เนื่องจากเกิดขึ้นซี่ง่ายมากขึ้นเท่ากันและขจัดที่เท่ากัน แต่คู่นี้ก็ได้ล้มลงก่อนที่จะสุดสูงที่จุด 1.0588 ด้วยนั้น ระดับสนับสนุนสำคัญถูกกำหนดไว้แล้วที่ระดับ 1.0545 ในวันนี้ คู่ EUR/USD ส่วนที่ระดับความต้านทานที่ระดับ

Mourad El Keddani 22:52 2023-10-30 UTC+2
หากไม่สะดวกคุยในตอนนี้
ระบุคำถามไว้ได้ใน แชท.
Widget callback
 

Dear visitor,

Your IP address shows that you are currently located in the USA. If you are a resident of the United States, you are prohibited from using the services of InstaFintech Group including online trading, online transfers, deposit/withdrawal of funds, etc.

If you think you are seeing this message by mistake and your location is not the US, kindly proceed to the website. Otherwise, you must leave the website in order to comply with government restrictions.

Why does your IP address show your location as the USA?

  • - you are using a VPN provided by a hosting company based in the United States;
  • - your IP does not have proper WHOIS records;
  • - an error occurred in the WHOIS geolocation database.

Please confirm whether you are a US resident or not by clicking the relevant button below. If you choose the wrong option, being a US resident, you will not be able to open an account with InstaForex anyway.

We are sorry for any inconvenience caused by this message.