empty
25.11.2020 01:57 AM
EURUSD – someone leaked insider information ahead of time

The last trading day was one of the most dynamic in recent times. The EUR/USD quote showed activity in just two hours, comparable to the amplitude for the last week.

We can say a lot about the fact that the slowdown in the period earlier led to the accumulation of trade forces and that there was an acceleration of activity from the level of interaction of trade forces 1,1890/1,1900/1,1920.

It is no secret that yesterday, Mr. Donald Trump ordered the beginning of the transfer of power to Joe Biden. In fact, Trump has accepted defeat and Biden is considered the official winner and the new President of the United States.

The information was received tonight but there is an assumption that such valuable information was shared in a narrow circle before the official statement. Under the noise of positive statistics on the US business activity index, traders decided to buy the US Dollar.

The above is just a theory, but similar actions with early insider information were repeatedly encountered by traders from Wall Street.

The second theory, which will complement the first, is that Joseph Biden plans to nominate former Federal Reserve chair Janet Yellen for the post of Finance Minister.

This information could have leaked earlier than the official statement to the same insider circle, and since we are talking about the banking sector, the candidacy of Janet Yellen plays in favor of Wall Street and possible stimulus injections into the economy.

Now let's look at price fluctuations from the point of view of technical analysis.

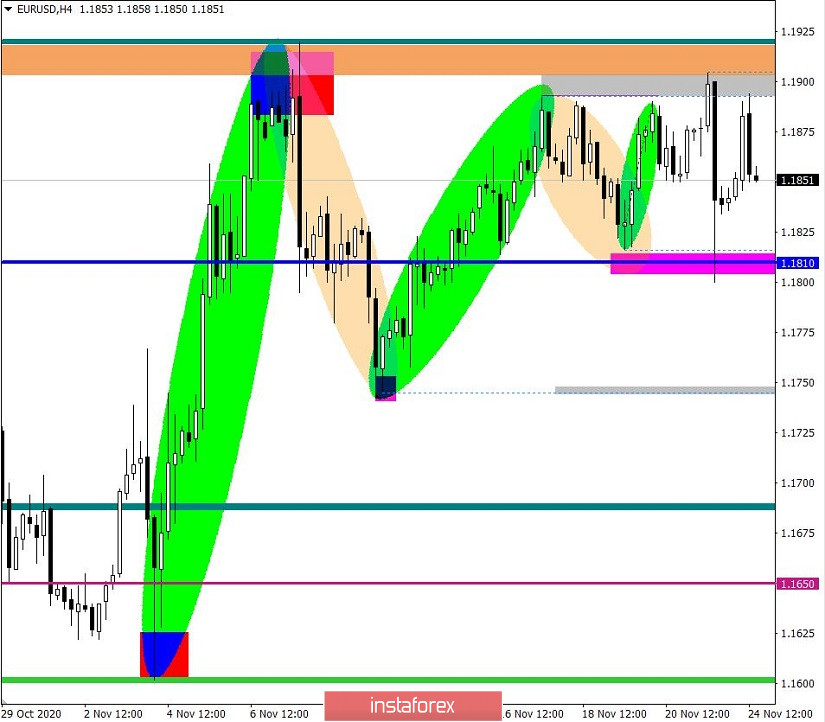
The market has been at a standstill since November 17, where the coordinates 1.1815/1.1900 served as variable boundaries. Activity was reduced to the limit. Sometimes it seemed that even speculators left the market. Area of interaction of trade forces 1,1890/1,1900/1,1920 withstood the onslaught of buyers, at the same time, it played the role of a lever that pushed sellers to inertia.

In simple words, the sale of the Euro was in the area of accumulation, which already exerted pressure on buyers, and a local break higher than the highs of November 17,18,20 led to the triggering of stop orders. As a result, we got inertia in the direction of 1.1800, where there was a recovery almost immediately.

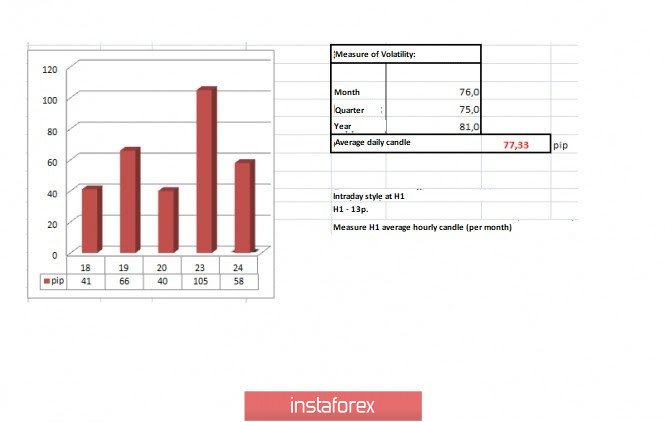
Returning to the market dynamics for November 23, we can see that the highest activity recorded for 10 trading days was at 105 points, which is 35% higher than the average level.

Looking at the trading chart in general terms (daily period), it is clear that the quote is at the top of the upward tract from the beginning of November, which returned the quote to the upper limit of the medium-term sideways trend.

This image is no longer relevant

Today, in terms of the economic calendar, we do not have statistics on Europe and the United States that are worth paying attention to, but based on practice, this does not stop speculators.

Analyzing the current trading schedule, you can see that the quotation of the Asian and European sessions actively restored positions in the Euro, which led to another touch of the area of interaction of trade forces 1,1890/1,1900/1,1920.

The area, as before, was maintained. The volume of long positions decreased, which returned the quotes to the variable coordinate of 1.1850.

The coefficient of speculative operations is growing, which has a positive effect on the market dynamics but the quote is squeezed between the level of 1.1810 and the area of interaction of trading forces 1,1890/1,1900/1,1920.

A breakout and fixation of the price outside one of the boundaries of 1.1810 or 1.1920 will most likely indicate a local entry and a major round of acceleration
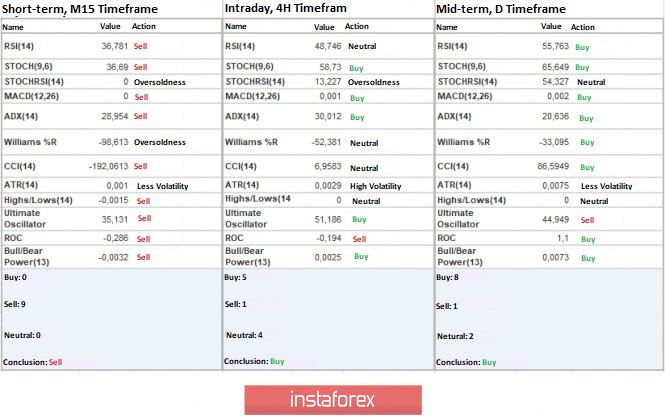
This image is no longer relevant

Indicator analysis

Analyzing a different sector of timeframes, it is clear that the indicators of technical instruments on the hourly and daily periods signal a purchase due to the next touch of the price of the area of interaction of trading forces. Minute intervals work to return the price to a variable coordinate, 1.1850 signaling a sale.

This image is no longer relevant

The volatility for the week / Measurement of volatility: month, quarter, and year

The measurement of volatility reflects the average daily fluctuation, calculated for the month, quarter, and year.

(November 24 was based on the date of publication of the article)

The dynamics of the current time is only 58 points, which is quite good for the Euro/Dollar currency pair. A high coefficient of speculative operations can still give acceleration to the market.

This image is no longer relevant

Key levels

Resistance zones: 1,1890-1,1900-1,1920**; 1,2000***; 1,2100*; 1,2450**; 1,2550; 1,2825.

Support areas: 1,1810*; 1,1700; 1,1612*;1,1500; 1,1350; 1,1250*;1,1180**; 1,1080; 1,1000***.

* Periodic level

* * Range level

***Psychological level

เลือกช่วงเวลา
5
นาที
15
นาที
30
นาที
1
ชั่วโมง
4
ชั่วโมง
1
วัน
1
สัปดาห์
รับผลกำไรจากการเปลี่ยนแปลงอัตราสกุลเงินดิจิทัลกับ InstaForex.
ดาวน์โหลด MetaTrader 4 และเปิดการซื้อขายครั้งแรกของคุณ.
  • Grand Choice
    Contest by
    InstaForex
    InstaForex always strives to help you
    fulfill your biggest dreams.
    เข้าร่วมการแข่งขัน


บทความแนะนำ

USD/JPY: เคล็ดลับการเทรดง่ายๆ สำหรับนักเทรดมือใหม่ในวันที่ 14 มีนาคม (ตลาดสหรัฐ)

การทดสอบที่ราคา 148.72 เกิดขึ้นเมื่อดัชนี MACD ได้เคลื่อนที่ขึ้นมาเหนือระดับศูนย์เป็นอย่างมากแล้ว ทำให้ศักยภาพในการขึ้นของคู่เงินถูกจำกัด ด้วยเหตุนี้ฉันจึงไม่ได้ซื้อดอลลาร์ การทดสอบครั้งที่สองของ 148.72 เกิดขึ้นเมื่อ MACD อยู่ในโซนที่มีการซื้อเกินแล้ว ทำให้เกิดสถานการณ์ที่ 2 ในการขาย

Jakub Novak 16:50 2025-03-14 UTC+2

GBP/USD: เคล็ดลับการเทรดง่ายๆ สำหรับนักเทรดมือใหม่ วันที่ 14 มีนาคม (ช่วงตลาดสหรัฐฯ)

การทดสอบราคาที่ 1.2934 ตรงกับตัวบ่งชี้ MACD ที่เริ่มเคลื่อนตัวลงจากระดับศูนย์ ซึ่งยืนยันถึงความถูกต้องของจุดเริ่มเข้า ส่งผลให้คู่สกุลเงินลดลงเพียง 15 จุดเท่านั้น เงินปอนด์ตอบสนองด้วยการลดลงเพียงเล็กน้อยต่อข่าวที่ GDP ของสหราชอาณาจักรหดตัวในเดือนมกราคม อย่างไรก็ตาม การลดลงนี้ค่อนข้างเล็กน้อย แสดงให้เห็นถึงความแข็งแกร่งของสกุลเงินปอนด์ต่อการเปลี่ยนแปลงทางเศรษฐกิจระยะสั้น

Jakub Novak 16:02 2025-03-14 UTC+2

EUR/USD: เคล็ดลับการซื้อขายง่ายๆ สำหรับนักเทรดมือใหม่ในวันที่ 14 มีนาคม (ช่วงเวลาตลาดสหรัฐอเมริกา)

การทดสอบราคาที่ระดับ 1.0861 เกิดขึ้นในช่วงที่ตัวบ่งชี้ MACD ได้เพิ่มขึ้นอย่างมากเหนือระดับศูนย์​แล้ว ทำให้ขีดจำกัดความเป็นไปได้ในการขึ้นของคู่เงินนี้​ ด้วยเหตุนี้ ฉันจึงไม่ได้ซื้อยูโร ส่งผลให้ไม่มีการซื้อขายหรือเคลื่อนไหวเกิดขึ้น ข้อมูลเงินเฟ้อจริงจากเยอรมันและฝรั่งเศสตรงกับการคาดการณ์เบื้องต้นของนักเศรษฐศาสตร์​ ทำให้เงินยูโรเพิ่มขึ้นเล็กน้อยในช่วงครึ่งแรกของวัน แต่การเพิ่มขึ้นนี้เป็นไปได้ไม่นานและไม่มาก เนื่องจากผู้เข้าร่วมตลาดยังคงระมัดระวังก่อนวันหยุดสุดสัปดาห์ ขณะรอความชัดเจนเพิ่มเติมเกี่ยวกับการตัดสินใจทางนโยบายการเงินของธนาคารกลางยุโรปในอนาคต แน่ชัดว่า

Jakub Novak 15:40 2025-03-14 UTC+2

USD/JPY: เคล็ดลับการเทรดง่ายๆ สำหรับนักเทรดมือใหม่ในวันที่ 14 มีนาคม รีวิวการเทรดฟอเร็กซ์เมื่อวานนี้

การทดสอบในระดับราคาที่ 148.02 ได้เกิดขึ้นเมื่อตัวบ่งชี้ MACD เพิ่งเริ่มเคลื่อนไหวลงจากเครื่องหมายศูนย์ ซึ่งยืนยันจุดเข้าในการขายดอลลาร์ที่มีความถูกต้อง ส่งผลให้คู่เงินลดลงสู่ระดับเป้าหมายที่ 147.64 การซื้อ ณ ระดับนั้นเมื่อดีดตัวช่วยให้สามารถทำกำไรเพิ่มเติมได้ 40 พิพ ความคาดหวังต่อการเพิ่มอัตราดอกเบี้ยเพิ่มเติมโดยธนาคารกลางญี่ปุ่นยังคงเป็นตัวกระตุ้นการซื้อเงินเยนอยู่ นักลงทุนที่ต้องการใช้ประโยชน์จากการเพิ่มขึ้นของผลตอบแทนจากสินทรัพย์ญี่ปุ่นมีการเปลี่ยนเงินตราต่างประเทศเป็นเงินเยนอย่างต่อเนื่อง

Jakub Novak 08:20 2025-03-14 UTC+2

GBP/USD: เคล็ดลับการเทรดที่ง่ายสำหรับนักเทรดมือใหม่ในวันที่ 14 มีนาคม รีวิวการเทรดฟอเร็กซ์เมื่อวานนี้

การทดสอบระดับราคาที่ 1.2941 ครั้งแรกเกิดขึ้นเมื่อดัชนี MACD ได้เคลื่อนตัวลงไปมากแล้วจากจุดศูนย์ ทำให้ศักยภาพในการลดลงของคู่เงินค่อนข้างจำกัด ด้วยเหตุนี้ฉันจึงเลือกที่จะไม่ขายเงินปอนด์ การทดสอบครั้งที่สองที่ระดับ 1.2941 ซึ่งเกิดขึ้นไม่นานหลังจากนั้น ตรงกับสัญญาณ MACD ที่อยู่ในภาวะขายมากเกินไป ทำให้ Scenario

Jakub Novak 08:20 2025-03-14 UTC+2

EUR/USD: เคล็ดลับการเทรดง่ายๆ สำหรับนักเทรดมือใหม่ในวันที่ 14 มีนาคม รีวิวการเทรดฟอเร็กซ์เมื่อวานนี้

การทดสอบราคาที่ระดับ 1.0865 เกิดขึ้นเมื่อดัชนี MACD ได้เคลื่อนไหวลงไปอย่างมากจากจุดศูนย์ ซึ่งในมุมมองของฉันทำให้ความเป็นไปได้ในการลดลงของคู่สกุลเงินนี้มีจำกัด ด้วยเหตุนี้ ฉันจึงเลือกที่จะไม่ขายเงินยูโร หลังจากการลดลงที่ฉันพลาดไป โอกาสดีในการซื้อเกิดขึ้นเมื่อราคาฟื้นตัวจากระดับ 1.0831 ซึ่งฉันได้กล่าวไว้ในพยากรณ์เมื่อวานนี้ ทำให้สกุลเงินยูโรฟื้นตัวไปมากกว่า 30 pips

Jakub Novak 08:19 2025-03-14 UTC+2

กลยุทธ์การเทรดรายวันสำหรับนักเทรดมือใหม่ วันที่ 14 มีนาคม

ค่าเงินยูโรและเงินปอนด์กำลังประสบการปรับฐานอยู่ แม้จะไม่เด่นชัดมากนักและอาจปรับเปลี่ยนไปสู่แนวโน้มการเติบโตใหม่สำหรับสินทรัพย์เสี่ยง โดยที่ระดับสูงสุดรายสัปดาห์จะถูกอัปเดตอีกครั้ง เมื่อวานนี้ เงินดอลลาร์แทบไม่มีปฏิกิริยาตอบสนองต่อข่าวที่ว่าราคาผู้ผลิตในสหรัฐฯ ไม่เปลี่ยนแปลงเมื่อเทียบกับเดือนก่อน แม้ว่าจะมีการคาดการณ์ไว้ว่าจะเพิ่มขึ้นอย่างมาก ความเสถียรที่น่าประหลาดใจนี้สามารถเกิดขึ้นได้จากหลายปัจจัย ประการแรก ตลาดอาจได้รวมราคาที่คาดการณ์ถึงนโยบาย Federal Reserve ที่มีท่าทีผ่อนคลายกว่าแล้ว ทำให้ข้อมูลที่เป็นกลางไม่มีอะไรมากที่น่าประหลาดใจ ประการที่สอง

Miroslaw Bawulski 07:19 2025-03-14 UTC+2

USD/JPY: เคล็ดลับการซื้อขายง่ายๆ สำหรับนักเทรดมือใหม่ในวันที่ 13 มีนาคม (ช่วงการซื้อขายของสหรัฐฯ)

การทดสอบราคาที่ระดับ 147.64 เกิดขึ้นในขณะที่ตัวชี้วัด MACD ได้เคลื่อนลงอย่างมีนัยสำคัญจากเส้นศูนย์ ซึ่งทำให้ศักยภาพในการลดลงของคู่เงินลดลง ด้วยเหตุนี้ฉันจึงไม่ได้ขายดอลลาร์ การทดสอบครั้งที่สองที่ระดับ 147.64 เกิดขึ้นเมื่อตัวชี้วัด MACD อยู่ในเขต oversold แล้ว ทำให้สถานการณ์

Jakub Novak 18:38 2025-03-13 UTC+2

GBP/USD: เคล็ดลับการเทรดง่ายๆ สำหรับนักเทรดมือใหม่ ในวันที่ 13 มีนาคม (ช่วงตลาดสหรัฐอเมริกา)

การทดสอบราคาที่ 1.2945 เกิดขึ้นขณะที่ตัวชี้วัด MACD ได้เคลื่อนลงอย่างมากจากค่าเริ่มต้น ซึ่งจำกัดศักยภาพในการเคลื่อนลงของคู่สกุลเงินนี้ ด้วยเหตุนี้ฉันจึงไม่ขายเงินปอนด์ การทดสอบครั้งที่สองที่ 1.2945 หลังจากผ่านไประยะสั้น ๆ อนุญาตให้ฉากที่ 2 ในการซื้อเกิดขึ้นภายในแนวโน้มขาขึ้นอย่างต่อเนื่อง นำไปสู่การเพิ่มขึ้นเพียง

Jakub Novak 18:35 2025-03-13 UTC+2

EUR/USD: เคล็ดลับการซื้อขายง่าย ๆ สำหรับนักเทรดมือใหม่ในวันที่ 13 มีนาคม (เซสชั่นสหรัฐฯ)

การทดสอบราคาที่ 1.0875 เกิดขึ้นเมื่อดัชนี MACD ได้เคลื่อนตัวลงมาจากระดับศูนย์อย่างมีนัยยะสำคัญ ซึ่งจำกัดศักยภาพการลดลงของคู่เงินในตลาดขาขึ้น ดังนั้น ฉันจึงไม่ขายเงินยูโร การทดสอบครั้งที่สองที่ 1.0875 เกิดขึ้นเมื่อดัชนี MACD อยู่ในเขตซื้อมากเกินไปแล้ว ซึ่งเป็นโอกาสสำหรับ Scenario

Jakub Novak 18:31 2025-03-13 UTC+2
หากไม่สะดวกคุยในตอนนี้
ระบุคำถามไว้ได้ใน แชท.
Widget callback
 

Dear visitor,

Your IP address shows that you are currently located in the USA. If you are a resident of the United States, you are prohibited from using the services of InstaFintech Group including online trading, online transfers, deposit/withdrawal of funds, etc.

If you think you are seeing this message by mistake and your location is not the US, kindly proceed to the website. Otherwise, you must leave the website in order to comply with government restrictions.

Why does your IP address show your location as the USA?

  • - you are using a VPN provided by a hosting company based in the United States;
  • - your IP does not have proper WHOIS records;
  • - an error occurred in the WHOIS geolocation database.

Please confirm whether you are a US resident or not by clicking the relevant button below. If you choose the wrong option, being a US resident, you will not be able to open an account with InstaForex anyway.

We are sorry for any inconvenience caused by this message.