empty
04.09.2024 06:31 PM
Analysis of GBP/USD. September 4. A Slow Start for the Pound

This image is no longer relevant

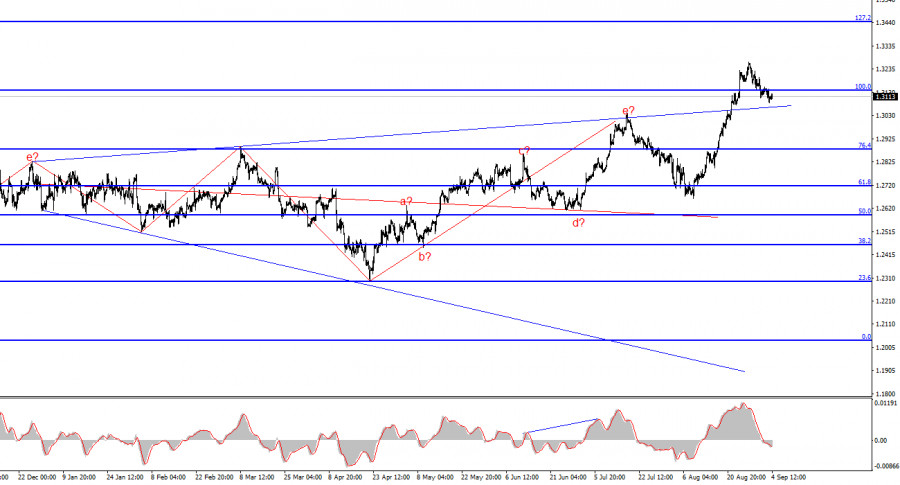
The wave pattern for GBP/USD remains quite complex and ambiguous. For some time, the wave structure seemed convincing, indicating a downward wave set with targets below the 1.2300 level. However, demand for the U.S. dollar grew too strong for this scenario to play out, and it continues to increase.

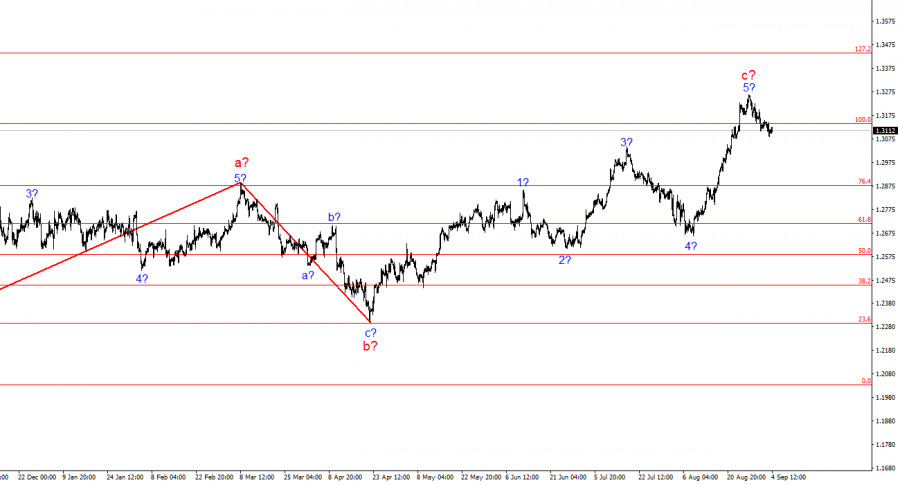
At the moment, the wave pattern has become difficult to interpret. In my analysis, I generally use simple structures because complex ones often involve too many nuances and ambiguities. We have now observed another upward wave, which has pushed the pair beyond the triangular consolidation pattern. The current upward wave set, which likely began on April 22, could extend further as the market appears unsettled until it fully prices in all stages of the Fed's rate-cutting cycle. A three-wave corrective structure is forming again, and a successful break of the 1.3142 level, which corresponds to the 100% Fibonacci retracement, indicates the market's readiness for at least a slight decline.

On Wednesday, the GBP/USD exchange rate again remained relatively flat. Every time the dollar attempts to strengthen, something inevitably halts its progress. Yesterday, the market was ready to increase demand for the U.S. dollar, but the ISM manufacturing index wasn't convincing enough. Today, the market was prepared to boost dollar demand, but the final UK services PMI came out higher than the preliminary estimate. Everything seems to be working against the U.S. currency.

For the next few days, the dollar is likely to struggle to gain market support. For now, sellers are holding to the critical 1.3142 level, which still gives them a chance to form at least one corrective wave. Ideally, there should be at least three corrective waves. It may seem pessimistic, but the U.S. has not received any positive economic news over the past four months. Tomorrow, the U.S. ISM services PMI will be released, and the market expects a decline for August. As this index hovers near the 50.0 level, below which any reading signals a negative trend, the situation for the U.S. economy and currency is becoming increasingly tense.

On Friday, the fate of the dollar will be decided: either it will get a reprieve or face a significant decline. The Nonfarm Payrolls report needs to exceed 160,000 for the dollar's recovery to continue. The unemployment rate must not rise above 4.3% for the dollar to gain value. In my view, the 1.3000 level is the maximum target for sellers this week.

This image is no longer relevant

Conclusions

The wave structure for GBP/USD still suggests a decline. If the upward trend began on April 22, it has already formed a five-wave structure. Therefore, a minimum of a three-wave correction is now expected. I believe selling with targets around 1.2627 is appropriate, at least as long as sellers hold below the 1.3142 level.

On a larger wave scale, the wave structure has evolved. We can now assume the formation of a complex and extended upward corrective structure. Currently, this is a three-wave structure, but it could evolve into a five-wave structure, which may take several months to complete.

Key Principles of My Analysis

  1. Wave structures should be simple and understandable. Complex structures are challenging to trade and are often subject to changes.
  2. If you're unsure of what's happening in the market, it's better to stay out.
  3. There is never 100% certainty in the market's direction. Always use protective Stop Loss orders.
  4. Wave analysis can be combined with other types of analysis and trading strategies.
Seleccione el marco de tiempo
5
min
15
min
30
min
1
hora
4
horas
1
día
1
s.
Gana con los cambios en el valor de las criptomonedas con InstaForex.
Descarga MetaTrader 4 y abre tu primera operación.
  • Grand Choice
    Contest by
    InstaForex
    InstaForex always strives to help you
    fulfill your biggest dreams.
    UNIRSE AL CONCURSO

Recommended Stories

Análisis del par EUR/USD. El 7 de julio. ¿Dónde se encuentra la raíz de todos los problemas del dólar?

El conteo de ondas en el gráfico de 4 horas para el instrumento EUR/USD permanece sin cambios. Actualmente estamos observando la formación de la supuesta onda

Chin Zhao 15:58 2024-07-07 UTC+2

Análisis del par EUR/USD. El 6 de julio. El destino complicado del dólar.

El conteo de ondas en el gráfico de 4 horas para el instrumento EUR/USD permanece sin cambios. Actualmente estamos observando la formación de la supuesta onda

Chin Zhao 15:57 2024-07-07 UTC+2

Análisis del par GBP/USD. El 6 de julio. La libra quiere caer, pero no puede.

La estructura de ondas del instrumento GBP/USD sigue siendo bastante complicada y muy confusa. Alrededor del nivel de 1.2822, que corresponde al 23.6% de Fibonacci y está cerca del pico

Chin Zhao 15:57 2024-07-07 UTC+2

Análisis del par GBP/USD. El 22 de junio. El mercado espera la primera bajada de los tipos de interés en agosto.

El patrón de onda para el instrumento GBP/USD sigue siendo bastante complicado y confuso. Un intento exitoso de romper el nivel de Fibonacci del 50,0% en abril indicó

Chin Zhao 13:12 2024-06-22 UTC+2

Análisis del par EUR/USD. El 22 de junio. La Fed: No está lista para el aterrizaje.

En el gráfico de 4 horas, no hay cambios en la marca de la onda para el instrumento EUR/USD. En este momento, observamos la construcción de la esperada onda

Chin Zhao 10:51 2024-06-22 UTC+2

Análisis del par GBP/USD. El 8 de junio. Los británicos retrocedieron, pero no se rindieron.

El patrón de onda para el instrumento GBP/USD sigue siendo bastante complicado. El intento exitoso de romper el nivel de Fibonacci del 50,0% en abril indicó que el mercado está

Chin Zhao 08:27 2024-06-09 UTC+2

Análisis del par EUR/USD. El 8 de junio. El BCE confía en una mayor desaceleración de la inflación.

El patrón de onda del gráfico de 4 horas para el instrumento EUR/USD se mantiene sin cambios. En este momento, estamos observando la construcción de la onda esperada

Chin Zhao 08:26 2024-06-09 UTC+2

EUR/USD. Análisis del 2 de octubre. Las estadísticas europeas vuelven a decepcionar y el euro vuelve a caer

El análisis de ondas del gráfico de 4 horas para el par euro/dólar sigue siendo bastante claro. Durante el año pasado, solo hemos visto tres estructuras onduladas que se alternan

Chin Zhao 17:48 2023-10-02 UTC+2

Pronóstico semanal basado en un análisis de ondas simplificado para EUR/USD, USD/JPY, GBP/JPY, USD/CAD, NZD/USD y Oro a partir del 28 de agosto

Al inicio de la semana, es probable que el gráfico del euro indique un descenso en los límites de la zona de soporte. En la segunda mitad, espere un aumento

Isabel Clark 11:45 2023-08-28 UTC+2

Análisis para el 3 de julio de GBP/USD. El sector manufacturero de EE.UU. también está experimentando problemas.

El patrón de ondas para el par libra/dólar se ha vuelto más sencillo. En lugar de un segmento de tendencia correctiva compleja, podemos ver una tendencia alcista impulsiva

Chin Zhao 22:54 2023-07-03 UTC+2
¿No puede hablar ahora mismo?
Ingrese su pregunta en el chat.
Widget callback
 

Dear visitor,

Your IP address shows that you are currently located in the USA. If you are a resident of the United States, you are prohibited from using the services of InstaFintech Group including online trading, online transfers, deposit/withdrawal of funds, etc.

If you think you are seeing this message by mistake and your location is not the US, kindly proceed to the website. Otherwise, you must leave the website in order to comply with government restrictions.

Why does your IP address show your location as the USA?

  • - you are using a VPN provided by a hosting company based in the United States;
  • - your IP does not have proper WHOIS records;
  • - an error occurred in the WHOIS geolocation database.

Please confirm whether you are a US resident or not by clicking the relevant button below. If you choose the wrong option, being a US resident, you will not be able to open an account with InstaForex anyway.

We are sorry for any inconvenience caused by this message.