empty
16.11.2021 10:35 AM
Trading plan for starters of EUR/USD and GBP/USD on November 16, 2021

Here are the details of the economic calendar for November 15, 2021:

Monday was traditionally accompanied by an absolutely empty macroeconomic calendar. Traders were focused on the information background, where the speech of ECB president Christine Lagarde provoked the euro's weakening. It is worth noting that her statements about inflationary expectations, as well as a slight increase in interest rates, upset investors.

Analysis of trading charts from November 15:

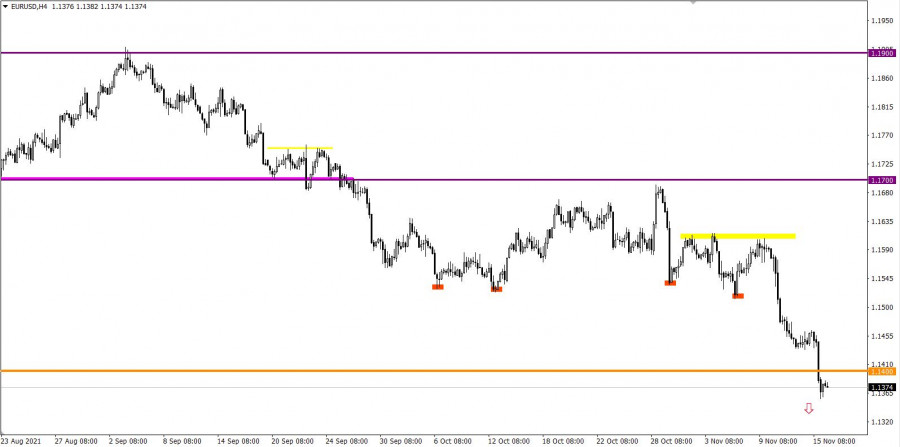
The European currency continued to decline against the US dollar after a short stagnation. As a result, the support level of 1.1400 was broken, and the quote dropped to the level of 1.1356.

Such a plot was expected in the market, so it was recommended earlier to enter into sell positions if the price is kept below the 1.1400 level.

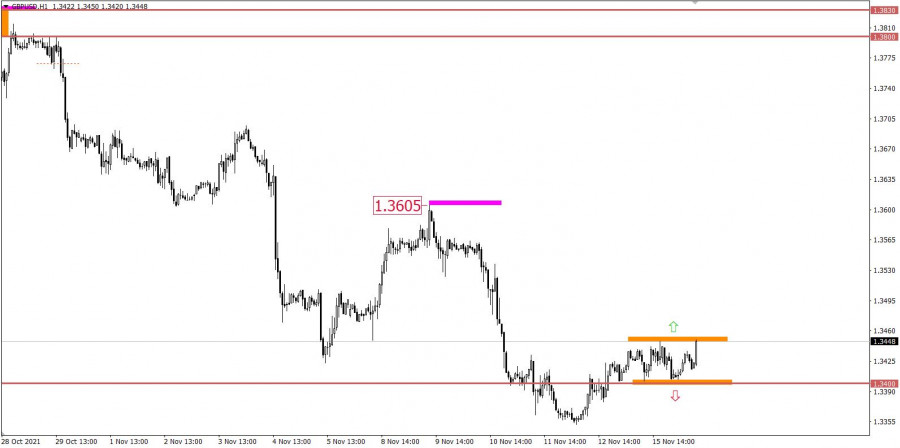
Unlike its counterpart in the market, the GBP/USD pair stood still, having an amplitude move within the borders of 1.3400/1.3450.

Selling positions were considered by the participants, but only after the price was kept below the 1.3400 mark. Thus, traders were outside the market yesterday, watching what was happening from the sidelines.

This image is no longer relevant

November 16 economic calendar:

The UK's labor market data was released today at 7:00 Universal time, where the unemployment rate declined from 4.5% to 4.3%. Meanwhile, employment in the country increased by 247 thousand during September.

The indicators for England are quite good, the pound sterling reacted to them with growth.

The next estimate of GDP for the 3rd quarter is expected to be published in Europe, where the indicator is likely to remain unchanged at 3.7%. This will not affect the market in any way if the statistics are confirmed.

At the same time, the United States will report on retail sales, the growth rate of which may slow from 13.9% to 12.0%. This is not the best signal for consumer activity in the country.

Trading plan for EUR/USD on November 16:

The quote may temporarily form a pullback towards the previously broken level of 1.1400 due to the euro's high oversold level. At the same time, the downward interest is actively supported by speculators. So, keeping the price below the level of 1.1350 may lead to a subsequent increase in the volume of short positions. This will open the way for sellers again.

This image is no longer relevant

Trading plan for GBP/USD on November 16:

It can be assumed that the price movement in the range of 1.3400/1.3450 will end soon. This will lead to a breakdown of one or another border with subsequent acceleration.

Trading recommendations:

  • Buy positions should be considered after holding the price above the level of 1.3455.
  • Sell positions should be considered after holding the price below the level of 1.3395.

This image is no longer relevant

What is reflected in the trading charts?

A candlestick chart view is graphical rectangles of white and black light, with sticks on top and bottom. When analyzing each candle in detail, you will see its characteristics of a relative period: the opening price, closing price, and maximum and minimum prices.

Horizontal levels are price coordinates, relative to which a stop or a price reversal may occur. These levels are called support and resistance in the market.

Circles and rectangles are highlighted examples where the price of the story unfolded. This color selection indicates horizontal lines that may put pressure on the quote in the future.

The up/down arrows are the reference points of the possible price direction in the future.

Summary
Urgency
Analytic
Vladislav Tukhmenev
Start trade
Gana con los cambios en el valor de las criptomonedas con InstaForex.
Descarga MetaTrader 4 y abre tu primera operación.
  • Depósito al azar
    ¡Haga un depósito en su cuenta de $3,000 y obtenga $1000 más!
    ¡En Octubre, sorteamos $1000 dentro de la campaña Depósito afortunado!
    Obtenga la oportunidad de ganar depositando $3,000 en una cuenta de operaciones. Tras haber cumplido esta condición, se convertirá en un participante de la campaña.
    UNIRSE AL CONCURSO

Recommended Stories

Bitcoin. El fortalecimiento del dólar podría dar un giro bajista al mercado de criptomonedas

Hoy, el mercado se centrará en la publicación del informe sobre la inflación en Estados Unidos, que se espera que muestre no solo que ha dejado de bajar, sino

Pati Gani 13:12 2025-06-11 UTC+2

Bitcoin. El logro de nuevos máximos puede detenerse

El precio del Bitcoin superó momentáneamente el nuevo nivel histórico de 111 000, pero no logró consolidarse por encima de él. El apoyo proviene, tanto para él como para

Pati Gani 10:53 2025-05-22 UTC+2

EUR/USD. El 12 de mayo. El conflicto en Ucrania podría llegar a su fin.

Buenos días, estimados traders. El par EUR/USD el viernes subió hacia la zona de resistencia 1,1265 – 1,1282, rebotó desde allí y giró a favor del dólar estadounidense. El proceso

Samir Klishi 10:27 2025-05-12 UTC+2

Pronóstico para el gas al 8 de abril de 2025

Gas natural (NG) Ni al final de la semana pasada, ni mucho menos al comienzo de la actual, la cotización del gas natural logró superar la resistencia de 4.200, reforzada

Laurie Bailey 08:11 2025-04-08 UTC+2

Pronóstico del gas para el 17 de marzo de 2025

Gas natural (NG) La jornada de hoy se abrió por encima de la línea indicadora Kruzenshtern en el marco diario. Al mismo tiempo, el oscilador Marlin cambió de dirección hacia

Laurie Bailey 07:02 2025-03-17 UTC+2

Pronóstico para el Bitcoin el 21 de febrero de 2025

Bitcoin El Bitcoin ha cambiado de opinión sobre el desarrollo de una caída hacia soportes objetivos cómodos, y en su lugar, siguiendo el sentimiento de riesgo general, ha revertido desde

Laurie Bailey 07:23 2025-02-21 UTC+2

Bitcoin - análisis técnico de la situación

Viernes, y el Bitcoin sigue esperando. Ninguna de las partes enfrentadas tiene prisa por presentarse y ser activa. En la incertidumbre actual, el posicionamiento de los principales índices de referencia

Evangelos Poulakis 07:45 2025-02-14 UTC+2

Previsión para el gas natural (GN) del 5 de febrero de 2025

En el gráfico semanal la semana pasada el precio se revirtió desde el nivel de soporte 3.017 - desde los máximos de septiembre 2024, agosto 2023, febrero 2023 y también

Laurie Bailey 07:51 2025-02-05 UTC+2

#NDX - análisis técnico de la situación

A finales del año pasado, el índice marcó un nuevo máximo histórico (22141), tras lo cual se detuvo la subida, comenzó la formación de la corrección y la consolidación. Ahora

Evangelos Poulakis 07:24 2025-02-04 UTC+2

Bitcoin 30 Enero - análisis técnico de la situación

A pesar de marcar un nuevo máximo la semana pasada (109986), el Bitcoin detuvo su tendencia alcista y comenzó a formar incertidumbre. Hasta ahora, el formato semanal ha proyectado

Evangelos Poulakis 07:24 2025-01-30 UTC+2
¿No puede hablar ahora mismo?
Ingrese su pregunta en el chat.
Widget callback
 

Dear visitor,

Your IP address shows that you are currently located in the USA. If you are a resident of the United States, you are prohibited from using the services of InstaFintech Group including online trading, online transfers, deposit/withdrawal of funds, etc.

If you think you are seeing this message by mistake and your location is not the US, kindly proceed to the website. Otherwise, you must leave the website in order to comply with government restrictions.

Why does your IP address show your location as the USA?

  • - you are using a VPN provided by a hosting company based in the United States;
  • - your IP does not have proper WHOIS records;
  • - an error occurred in the WHOIS geolocation database.

Please confirm whether you are a US resident or not by clicking the relevant button below. If you choose the wrong option, being a US resident, you will not be able to open an account with InstaForex anyway.

We are sorry for any inconvenience caused by this message.