Long positions on EUR/USD:
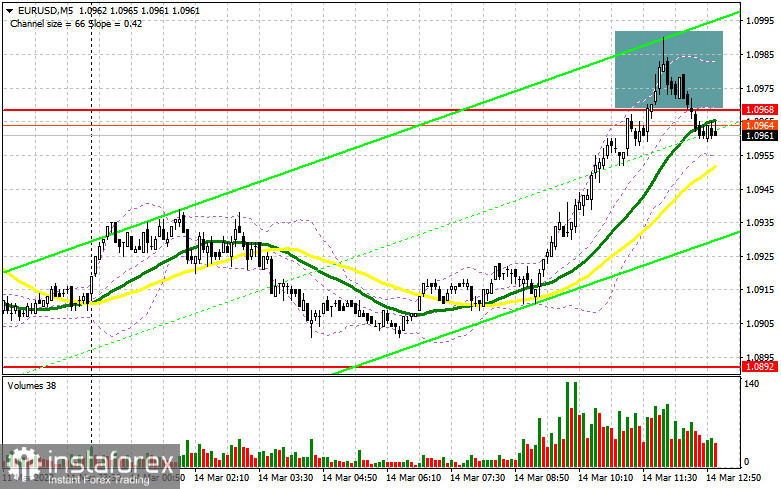
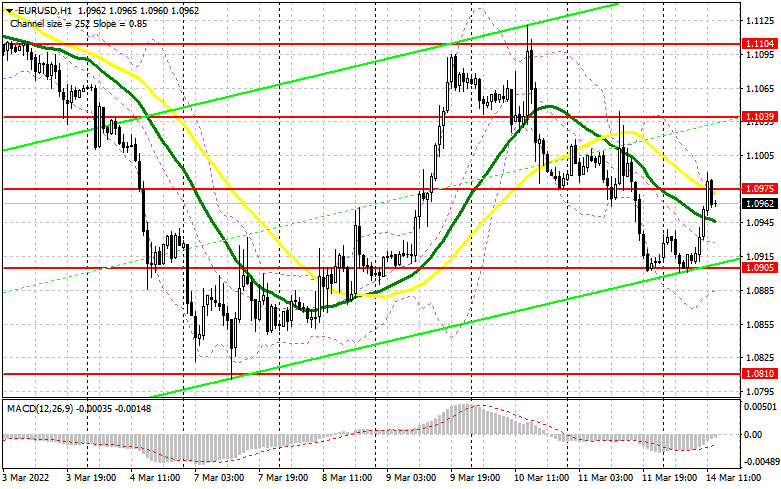
In my forecast this morning, I drew your attention to the level of 1.0968 and recommended entering the market from this level. Let's have a look at the 5-minute chart and analyze what happened. Bulls pushed the EUR/USD pair to 1.0970, and that is it for today. A false breakout at 1.0968 has created a sell signal for the euro, but bears have not shown their activity yet. As long as the pair is trading below this level, the decline is possible. Notably, there are no other entry points.
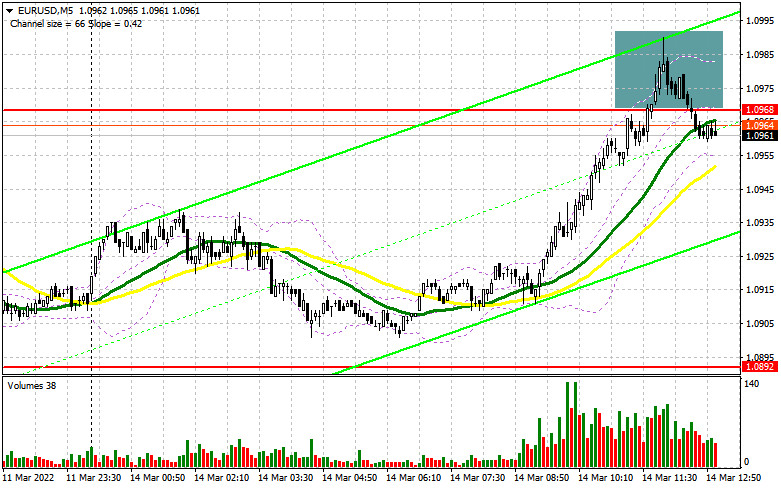
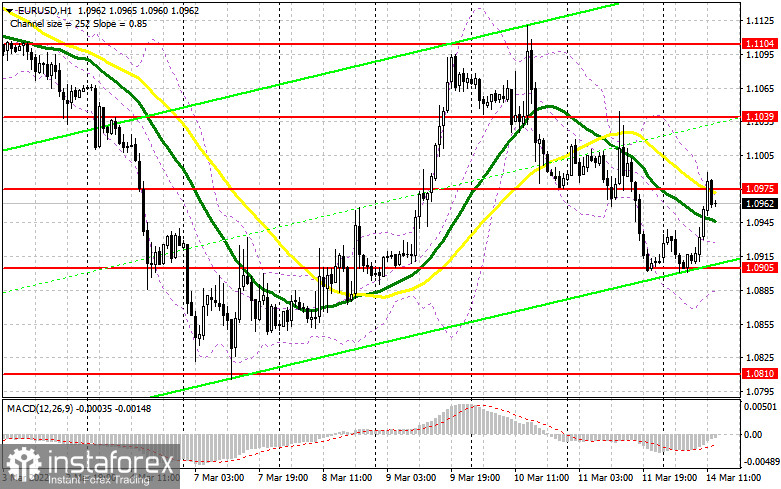
Major market players are waiting for the Fed's decisions, which may change the monetary policy of the US in the middle of this week. Everyone is also waiting for the results of the fourth meeting between Russia and Ukraine. The positive results of the negotiations may bring back demand for risky assets, including the euro. Notably, Christine Lagarde announced a more aggressive ECB policy last week. It is good news for bulls, who are just waiting for the geopolitical situation to ease. There is no data to be released this afternoon, and only the Eurogroup Meetings will take place. During the US session, bulls need to hold the price above support at 1.0905, which was revised from the morning's level of 1.0893. However, it would be good to break through 1.0975, where the moving averages are located, which are playing on the bears' side. If the pair declines, only a false breakout at 1.0905 may form the first entry point into the longs, counting on the pair to return to the area of 1.0975. If the pair reaches above this level, it may continue to rise. A reverse test top/bottom may form a buy signal for the euro and recover the pair to the area of 1.1039 and 1.1104. A breakthrough of this range is likely to cancel the bearish trend and trigger sellers' stop-loss orders, pushing the pair to the highs at 1.1176 and 1.1229, where traders may lock in profits. With another negotiation failure and a worsening of the conflict, demand for the US dollar could quickly return. Taking into account that the recent meeting between the representatives of the two countries did not bear any results, we should not expect serious progress in these negotiations either. If bulls show a lack of activity at 1.0905, a false breakout of the low around 1.0810 would be the best scenario for longs, and it is possible to open long positions on the euro only at 1.0772, allowing an upward intraday correction of 30-35 pips.
Short positions on EUR/USD:
Bears managed to hold the price below resistance this morning, but it did not trigger a large sell-off. As I noted, as long as the pair is trading below 1.0975, the euro is expected to fall. If the pair goes above this level, demand for the euro may return. The formation of a false breakout after another unsuccessful attempt to break above 1.0975 may create a sell signal and allow to open short positions with the target at the support of 1.0905. A breakthrough of this level and a reverse test bottom/top might take place very quickly, which will give an additional signal for short positions with the prospect of falling to the lows of 1.0810 and 1.0772. The decline may be fast, as there are a lot of buyers' stop-orders placed near these levels. The next target is located in the area of 1.0728, where traders may take a profit. However, only the Fed news or worsening geopolitical tension and failed negotiations are likely to trigger a large sell-off. If the euro grows and there is a lack of bears' activity at 1.0975, it would be better to postpone selling the euro. It is possible that bulls might be more aggressive. A breakthrough of this level may activate sellers' stop-loss orders. Therefore, the best scenario for short positions would be if a false breakout occurs around 1.1039. Selling the EUR/USD on the rebound is possible from 1.1104 or higher near 1.1176, allowing a downward correction of 25-30 pips.
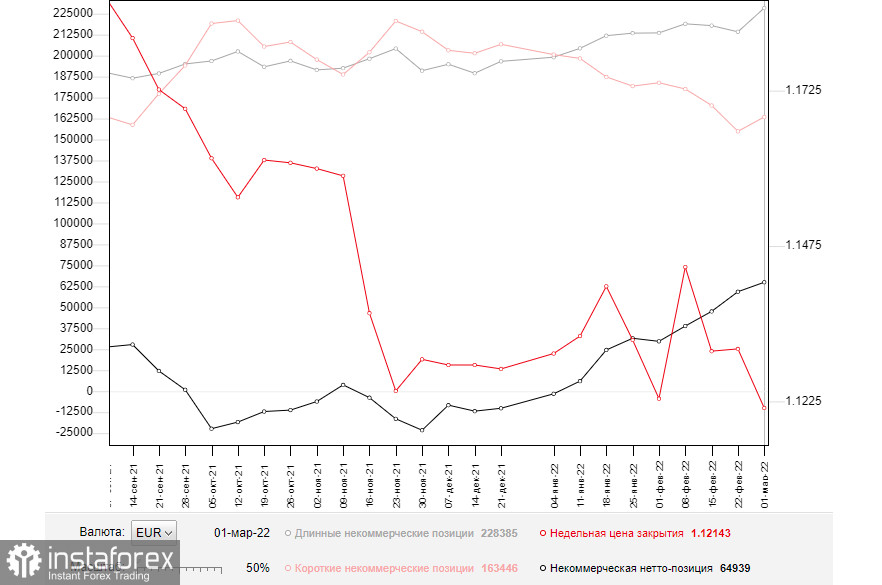
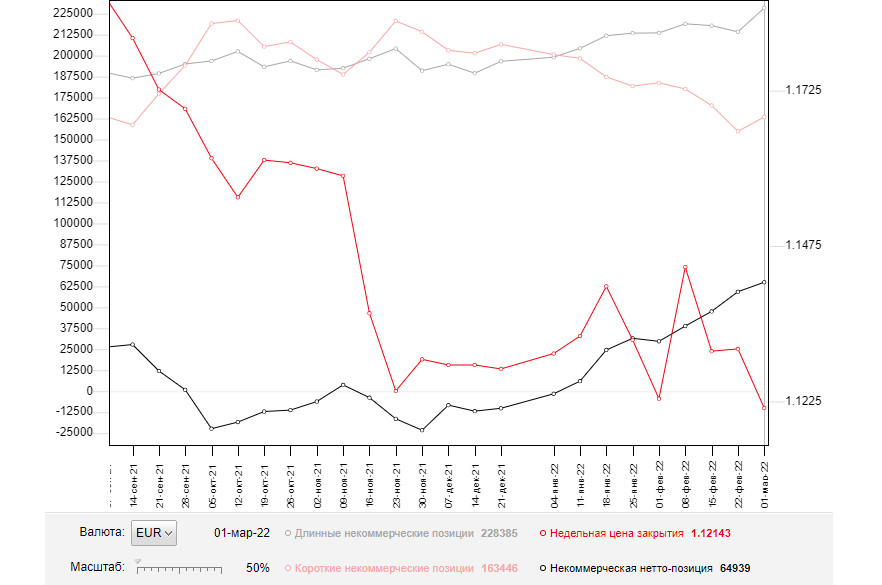
The COT (Commitment of Traders) report for March 1 showed an increase in both long and short positions. There are more longs and it reflects an increase in the positive delta. With the ongoing geopolitical conflict, which is affecting the whole world, it makes no sense what position investors had a week ago, as everything changes very fast. Those data that were available yesterday are no longer relevant today, as no one knows how the sanctions imposed by the US and the EU will affect the Russian economy, and what the conflict between Russia and Ukraine will eventually lead to. The main question is how long it will last. Against this background, it doesn't really matter what policy the European Central Bank or the Federal Reserve System will choose, because if the military conflict worsens, the markets are likely to nosedive again. Russia and Ukraine are negotiating, and much depends on the results of these meetings. This week, the European Central Bank meeting will be held and the important February US inflation data will be released, which may cause a spike in volatility. However, it is unlikely to change the situation in favor of buyers of risky assets. Investors are recommended buying the US dollar. It is better to be cautious with risky assets and to buy the euro only as tense relations between Russia, Ukraine, the EU, and the US weaken. Any new sanctions against Russia will have serious economic consequences, which will affect financial markets and not only the Russian ruble but also the euro. The COT report indicated that long non-commercial positions rose to 228,385 from 214,195, while short non-commercial positions rose to 163,446 from 154,163. At the end of the week, total non-commercial net positioning increased to 64,939 against 59,306. The weekly closing price dropped to 1.1214 from 1.1309.
Indicator signals:
Moving averages
Trading is carried out near the 30-day and 50-day moving averages, indicating intense competition between buyers and sellers.
Note: The period and prices of moving averages are viewed by the author on the hourly chart and differ from the general definition of classic daily moving averages on the daily chart.
Bollinger Bands
A breakthrough of the indicator's lower boundary at 1.0905 is likely to increase the pressure on the euro. A breakthrough of the upper boundary of the indicator at 1.0975 may lead to a rise in the pair.
Indicator description:
- Moving average (MA) determines the current trend by smoothing volatility and noise. Period 50. Colored yellow on the chart.
- Moving average (MA) determines the current trend by smoothing volatility and noise. Period 30. Colored green on the chart.
- Moving Average Convergence/Divergence (MACD). Fast EMA 12. Slow EMA 26. SMA 9.
- Bollinger Bands. Period 20
- Non-commercial traders are speculators such as individual traders, hedge funds, and large institutions who use the futures market for speculative purposes and meet certain requirements.
- Long non-commercial positions are the total long position of non-commercial traders.
- Non-commercial short positions are the total short position of non-commercial traders.
- Total non-commercial net position is the difference between short and long positions of non-commercial traders.