Long positions on EUR/USD:
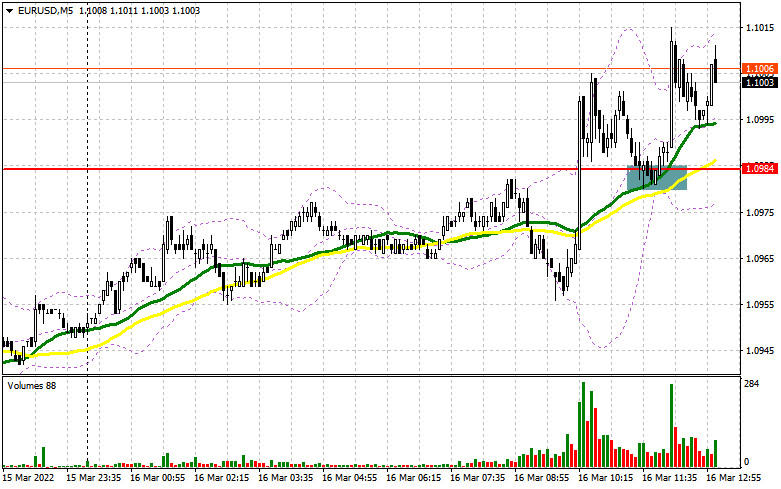
In my forecast this morning, I drew your attention to the level of 1.0984 and recommended entering the level from this market. Let's have a look at the 5-minute chart and analyze what happened. The euro buyers pulled the pair to 1.0984 against the background of the lack of economic data, and then the price has broken through this range and tested it from above. Such a reaction was expected, and I talked about it in detail in my morning's forecast. As a result, the pair formed a buy signal and climbed by about 30 pips, hitting yesterday's highs. In the second half of the day, the technical picture has completely changed. However, a lot will depend on the market reaction to the Fed statements, so the situation may unfold unpredictably.

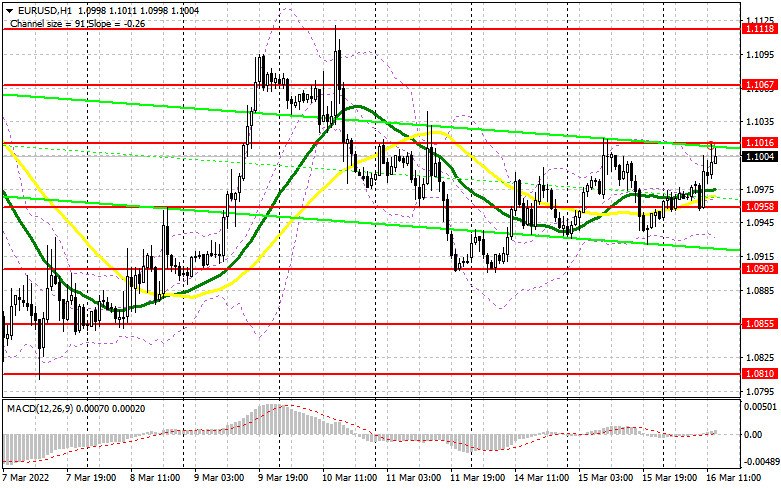
As I mentioned above, the surge in the euro amid a lack of statistical data was not surprising, especially after the news about the progress of negotiations between Russia and Ukraine. The parties are discussing the option of demilitarization of Ukraine according to the Austrian or Swedish scenario with the state keeping its army, but without the presence of foreign military units. This scenario may be considered as a compromise. Most likely, in the afternoon, all eyes will be on the outcome of the Federal Reserve's meeting. Investors wonder whether the central bank will pursue a more aggressive interest rate policy to protect the country from inflation or act according to its plan. This will determine the future of the EUR/USD pair. The Fed's plan includes a 0.25 point interest rate hike in March. At the moment, bulls need to protect the new support at 1.0958 during the US session, which was formed in the afternoon. In the case of the decline, only a false breakout at 1.0958 may become the first entry point to the longs, counting on the rise to resistance at 1.1016. The pair may go higher if there is some more activity from bulls, dovish rhetoric from the Fed chairman Jerome Powell and a breakthrough of 1.1016. A reverse test top/bottom of this level will create a buy signal for the euro and open the way for recovery to 1.1067 and 1.1118, where traders may lock in profits. In the case of a tougher Fed decision, demand for the US dollar may quickly return. If there is a lack of activity from bulls at 1.0958, and that is where the moving averages are playing on their side, a false breakout of the low at 1.0903 would be the best scenario for opening longs. Long positions could be opened on the rebound only from 1.0855, or lower at 1.0810, allowing an upward intraday correction of 30-35 pips.
Short positions on EUR/USD:
The bears failed to complete their tasks this morning, but they showed some activity near yesterday's high of 1.1016. As long as the trading is carried out below 1.1016, the euro's rally is likely to be limited. A false breakout of this level, before the release of the Federal Reserve decision, will be the first entry point into short positions, with the target at the support of 1.0958. A breakthrough and a retest to this level during Jerome Powell's press conference may form an additional sell signal, which is likely to drag the euro down to the lows of 1.0903 and 1.0855, where traders may take profits. Support at 1.0810 will be the next target, provided that the Fed raises the interest rate by 0.5 points. If the euro rises above 1.1016, it would be better to postpone selling the currency. Bulls might be more aggressive after the news on geopolitical tension easing. Therefore, the best scenario would be to open short positions if a false breakout occurs near 1.1067. Selling the EUR/USD pair on a rebound is possible from 1.1118, or higher from 1.1165, allowing a downward correction of 25-30 pips.

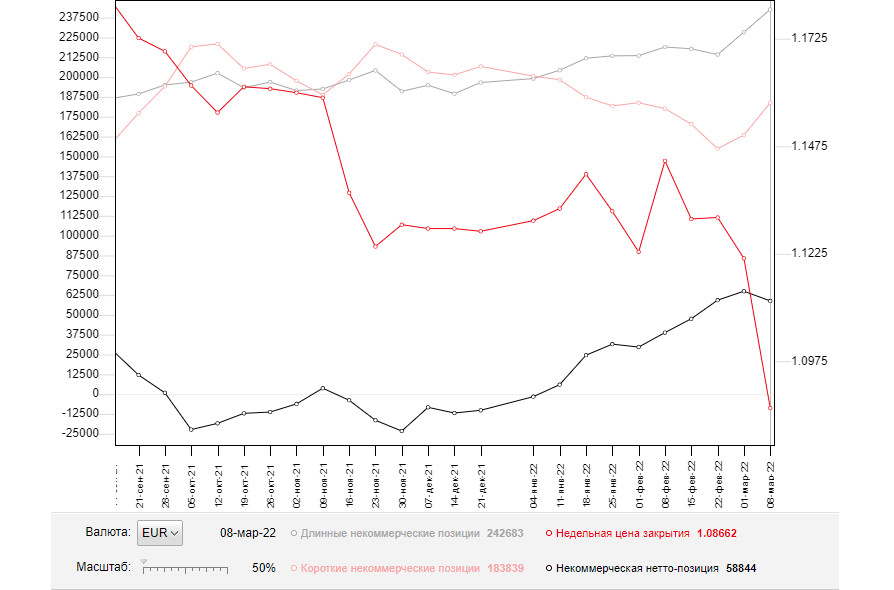
The COT (Commitment of Traders) report for March 8 showed an increase in both long and short positions. Notably, against the background of Russia's military special operation in Ukraine, there were more sellers, which led to a reduction in the positive delta. However, amid a major drop in the euro, bulls continued to act in the market and actively opened long positions, taking advantage of attractive prices. Last week, the European Central Bank held a meeting that unveiled the regulator's policy in more detail. This also adds confidence to buyers of risky assets in the current difficult geopolitical environment. Christine Lagarde announced that the ECB would more aggressively roll back its program to support the economy and raise interest rates. It created a strong bullish medium-term signal for euro buyers. This week, we have the Federal Reserve meeting and how the US regulator will act amid the highest inflation rate over the last 40 years is a big question. Although Russia and Ukraine continue negotiating, these meetings have not yielded any particular results. Against this background, investors are advised to keep buying the US dollar, as the bearish trend of EUR/USD persists. The COT report showed that long non-commercials rose to 242,683 from 228,385, while short non-commercials rose to 183,839 from 163,446. At the end of the week, total non-commercial net positions declined to 58,844 against 64,939. The weekly closing price dropped to 1.0866 from 1.1214.

Indicator signals:
Moving averages
Trading is carried out above the 30-day and 50-day moving averages, showing active purchases of the euro in the short term.
Note: The period and prices of moving averages are viewed by the author on the hourly chart and differ from the general definition of classic daily moving averages on the daily chart.
Bollinger Bands
A breakthrough of the indicator's lower boundary at 1.0934 will increase the pressure on the euro. A breakthrough of the upper boundary of the indicator at 1.1010 will push the pair upwards.
Indicator description:
- Moving average (MA) determines the current trend by smoothing volatility and noise. Period 50. Colored yellow on the chart.
- Moving average (MA) determines the current trend by smoothing volatility and noise. Period 30. Colored green on the chart.
- Moving Average Convergence/Divergence (MACD). Fast EMA 12. Slow EMA 26. SMA 9.
- Bollinger Bands. Period 20
- Non-commercial traders are speculators such as individual traders, hedge funds, and large institutions who use the futures market for speculative purposes and meet certain requirements.
- Long non-commercial positions are the total long position of non-commercial traders.
- Non-commercial short positions are the total short position of non-commercial traders.
- Total non-commercial net position is the difference between short and long positions of non-commercial traders.


