To open long positions on EUR/USD, you need:
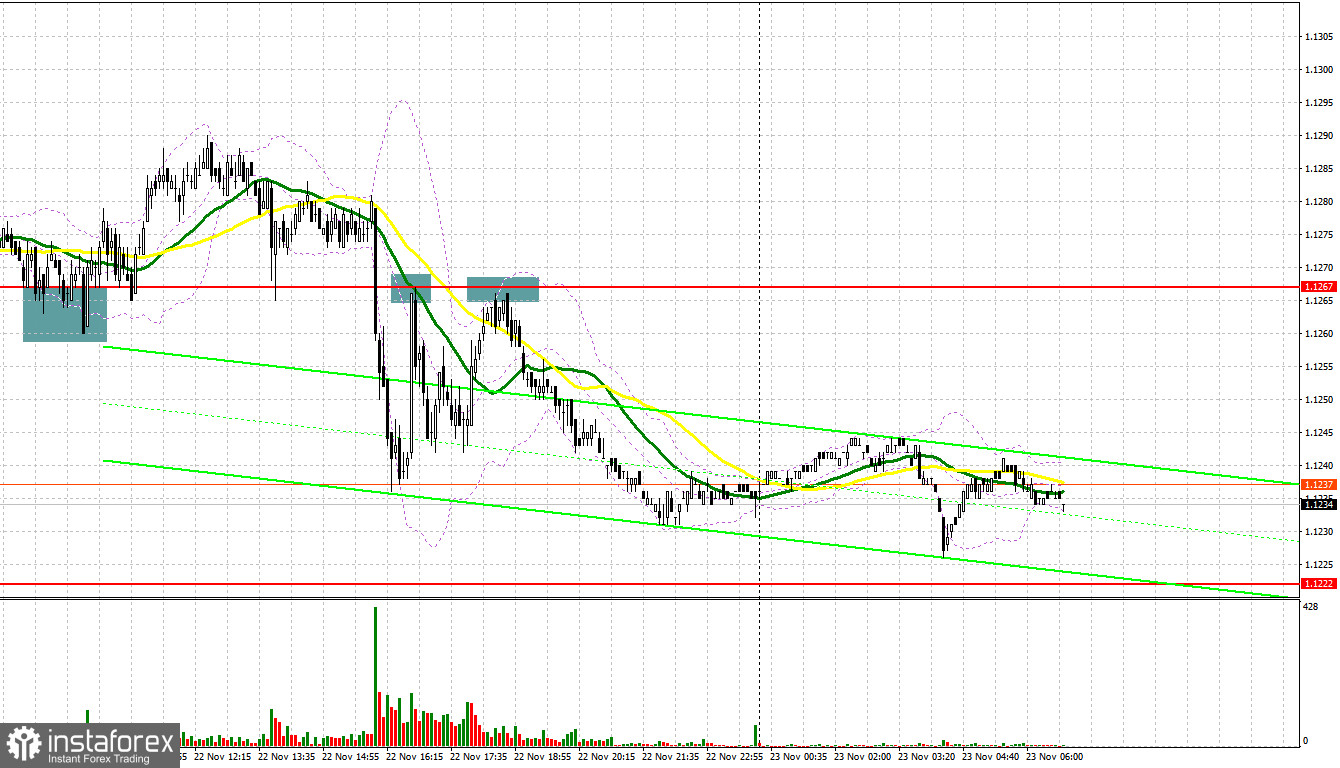
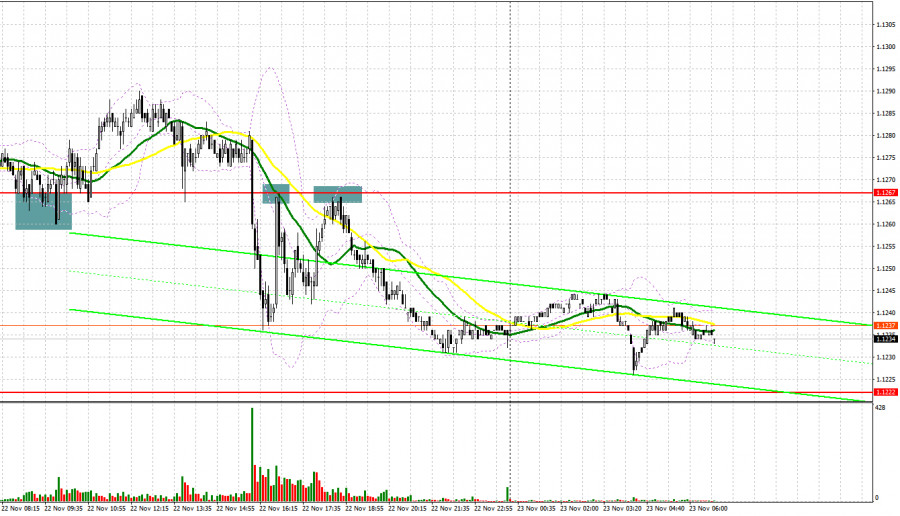
Despite the low volatility of the market against the background of the lack of fundamental data and further benchmarks, several signals to enter the market were formed yesterday and all of them turned out to be quite profitable. Let's take a look at the 5 minute chart and see what happened. Exactly according to the scenario, as I described yesterday morning, the formation of a false breakout at the level of 1.1267 led to the formation of a signal to buy the euro. And although a strong upward movement did not work, as a result, the pair passed 25 points from the entry point - and this was with a daily volatility of 29 at that time. In the afternoon, the bears took their toll and broke below 1.1267. A reverse test of this area from the bottom up led to the formation of signals to sell the euro. The downward movement was about 30 points.
Before talking about the future prospects of the EUR/USD movement, let's look at what happened in the futures market and how the positions of Commitment of Traders have changed. The Commitment of Traders (COT) report for November 16 revealed that both short and long positions increased. However, there were more of the former, which led to the return of the negative delta. And although it continues to balance in one range near the zero mark for quite a long time, this does not help euro bulls in any way. The risk of another surge in the spread of coronavirus and the lockdown of the EU countries has led to a return of pressure on the European currency, which has not yet managed to recover from the continuation of super-soft monetary policy by the European Central Bank, even against the backdrop of inflationary growth. Judging by what is happening, the ECB leaders have taken a fairly correct position. Austria has already returned to quarantine restrictions and strict isolation measures, and the German authorities are considering this - a very strong signal for the further weakening of the euro against the dollar. Meanwhile, in the US, the fact of high inflationary pressure continues to support the US dollar. Many investors are counting on an earlier increase in interest rates from the Federal Reserve next year and are already winning back the market in this direction. The latest November COT report indicated that long non-commercial positions rose from 192,544 to 198,181, while short non-commercial positions also jumped from 188,771 to 202,007. By the end of the week, the total non-commercial net position regained its negative value and amounted to -3,826 against 3,773. The weekly closing price dropped significantly, to the level of 1.1367 against 1.1587.
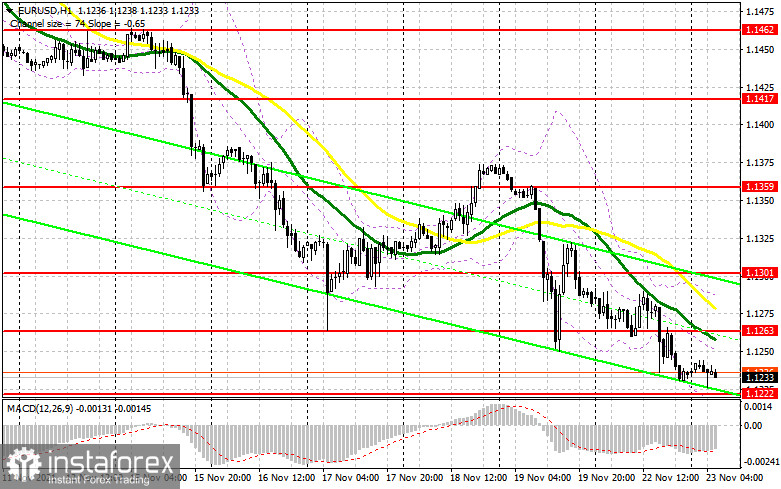
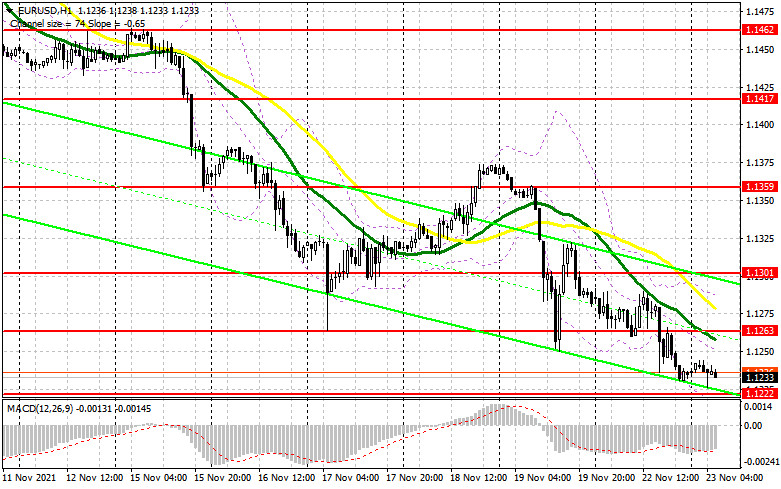
Today we have published quite interesting statistics on activity in the eurozone countries. There will be November reports on the PMI for the services sector, as well as the PMI for the manufacturing sector in Germany, France, Italy and the whole of the eurozone. In case of more positive results than forecasted, the euro may slightly strengthen its position against the US dollar. If not, then most likely the pressure on the pair will remain amid the risk of new lockdowns in European countries. If European indicators turn out to be better than economists' forecasts, we will get a chance for an upward correction in EUR/USD in the first half of the day. Therefore, the bulls' initial task is to settle above 1.1263, where the moving averages, limiting the pair's upward potential, pass. Only a breakthrough and test of this area from top to bottom generates a signal to open long positions, counting on the pair's growth. In this scenario, an equally important goal is to regain control over the next resistance at 1.1301, which will more or less level the situation for euro bulls. A breakthrough of this range with a similar consolidation forms an additional entry point to buy, which will lead EUR/USD to the local high of 1.1359, where I recommend taking profits. The best option for buying would be a downward correction in the first half of the day to the support area at 1.1222 and the formation of a false breakout there. Divergence on the MACD indicator, which should persist by this time, will be another confirmation of the correct entry into the market against the trend. In the absence of bullish activity at 1.1222, it is best to postpone buying, as the market is in a large bearish trend. Only a false breakout at 1.1193 forms a new entry point in hopes of an upward correction in the pair. I advise you to buy EUR/USD immediately on a rebound only after the first test of the low of 1.1155, or even lower - from the level of 1.1106, counting on an upward rebound of 15-20 points within the day.
To open short positions on EUR/USD, you need:
The bears achieved their target yesterday and continued the pair's downward trend. Today's data indicating a slowdown in activity in the eurozone towards the end of the year may further upset bulls, which will increase the pressure on the pair. However, a more convenient entry point into short positions will be the formation of a false breakout at the level of 1.1263, the test of which bulls are counting on. This will lead to the formation of the first signal to sell the euro further along the trend and push the pair into the area of a new weekly low at 1.1222. A breakthrough and test of this area from the bottom up will increase the pressure on EUR/USD and open the way to the areas: 1.1193 and 1.1155. I recommend taking profits on short positions there. In case the euro grows during the European session and the bears are not active around 1.1263, I advise you to postpone short positions until the next resistance test at 1.1301. But even there, it is best to open short positions after the formation of a false breakout. The best option for selling EUR/USD immediately on a rebound will be a high around 1.1359. You can count on a downward correction of 15-20 points.
Indicator signals:
Trading is carried out below 30 and 50 moving averages, which indicates a continuation of the bear market.
Moving averages
Note: The period and prices of moving averages are considered by the author on the H1 hourly chart and differs from the general definition of the classic daily moving averages on the daily D1 chart.
Bollinger Bands
In case of growth, the upper border of the indicator in the area of 1.1285 will act as a resistance. A breakout of the lower border of the indicator in the area of 1.1220 will increase the pressure on the pair.
Description of indicators
- Moving average (moving average, determines the current trend by smoothing out volatility and noise). Period 50. It is marked in yellow on the chart.
- Moving average (moving average, determines the current trend by smoothing out volatility and noise). Period 30. It is marked in green on the chart.
- MACD indicator (Moving Average Convergence/Divergence — convergence/divergence of moving averages) Quick EMA period 12. Slow EMA period to 26. SMA period 9
- Bollinger Bands (Bollinger Bands). Period 20
- Non-commercial speculative traders, such as individual traders, hedge funds, and large institutions that use the futures market for speculative purposes and meet certain requirements.
- Long non-commercial positions represent the total long open position of non-commercial traders.
- Short non-commercial positions represent the total short open position of non-commercial traders.
- Total non-commercial net position is the difference between short and long positions of non-commercial traders.