To open long positions on EUR/USD, you need:
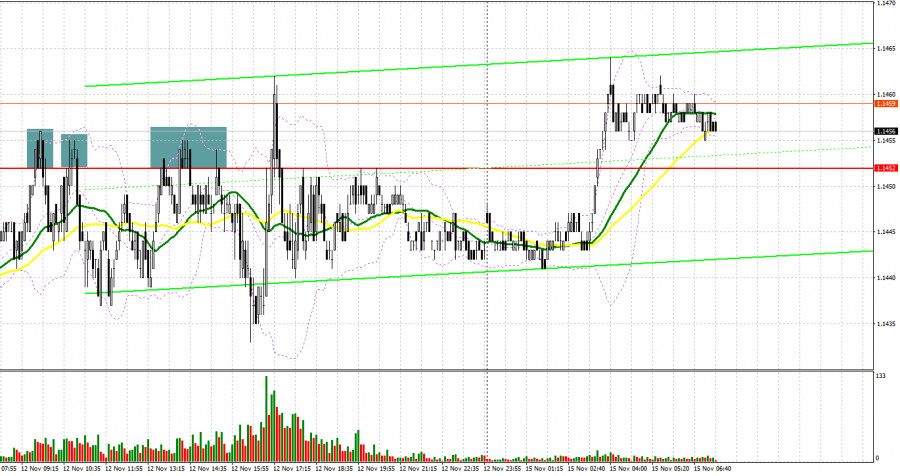
On Friday, amid a lack of willing bears, the euro was stuck in a narrow horizontal channel with very low volatility of about 25 points. But, despite this, several good signals were formed to enter the market. Let's look at the 5-minute chart and figure out the entry points. It can be seen how euro bulls are trying with all their might to regain control of the resistance of 1.1452, but nothing comes of it. After another unsuccessful attempt, a sell signal is formed. However, it also did not come to a major fall in the euro in the first half of the day. The downward movement was about 15 points – all intraday volatility. In the afternoon, several similar signals were formed, which showed a movement of 20+ points.

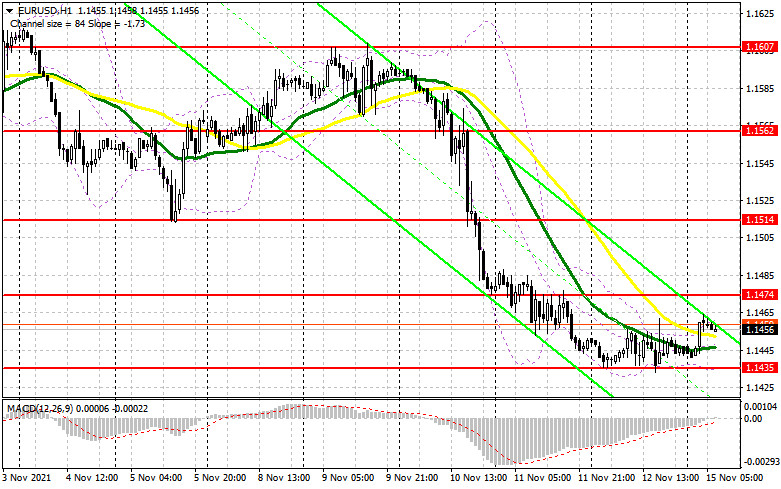
There are no important fundamental statistics on the eurozone today, but attention should be paid to the data on the foreign trade balance and the speech of European Central Bank President Christine Lagarde. Perhaps this will somehow shake up the market and lead to a surge in volatility. From a technical point of view, nothing much has changed compared to Friday, as the pair continues to be in a narrow horizontal channel. To return to the bull market during the European session, it is necessary to get beyond the new resistance of 1.1474, since only this scenario will stop the downward trend of the pair. The reverse test of 1.1474 from top to bottom after the publication of data on the eurozone will provide an entry point to long positions based on the growth of EUR/USD in the area of 1.1514. The fact that trading is conducted in the area of moving averages indicates the possibility of implementing such a scenario. A breakthrough of 1.1514 and a top-down test will lead to another buy signal and the pair will grow to a high like 1.1562, where I recommend taking profits. A more distant target will be the 1.1607 area. If the pressure on EUR/USD persists in the first half of the day, forming a false breakout in the 1.1435 area will limit the euro's fall and lead to forming a signal to open long positions, aiming for an upward correction. If traders are not active at 1.1435, it is best to wait for the formation of a false breakout in the area of 1.1379, but it is possible to open long positions on EUR/USD immediately for a rebound from the low like 1.1330, counting on a correction of 15-20 points within the day.
To open short positions on EUR/USD, you need:
Bears control the market, but they can lose the initiative at any moment. It is very important to know what Lagarde will talk about today. If the ECB continues to adhere to the ultra-soft scenario, the pressure on the euro will remain. Therefore, all that bears need to do is to protect the 1.1474 level. The entire calculation in the first half of the day will be based on bad data on the eurozone and the formation of a false breakout at this level. This forms the first signal to open short positions, which will provide an excellent point to the market in order to fall to the support of 1.1435. A breakdown and test of this area from the bottom up will increase pressure on EUR/USD and lead to the demolition of a number of bulls' stop orders counting on a larger upward correction last Friday. This will open the way to new lows: 1.1379 and 1.1330. I recommend taking profits on short positions there. In case the euro grows during the European session and the bears are not active in the area of 1.1474, I advise you to postpone short positions until the test of the next resistance of 1.1514. But even there, it is best to open short positions after the formation of a false breakout. The best option for selling EUR/USD immediately on a rebound will be a high in the area of 1.1562. You can count on a downward correction of 15-20 points.

I recommend for review:
The Commitment of Traders (COT) report for November 2 revealed a decrease in both long and short positions, which led to a negative delta since more sellers had exited the market than buyers. The monetary policy meetings of the leading central banks last week had a minor impact on the market. The Fed's stance on monetary policy boosted investors' optimism and restored faith in the continuing economic recovery. At the same time, expectations that the ECB, despite all its statements, will have to tighten its policy soon amid rising inflation give EUR a chance to recover in the intermediate term. With each new fall in price, demand for the euro increases. Tomorrow, the United States will deliver its inflation report. The greenback's future movement versus its main counterparts depends on its outcome. According to the COT report, long non-commercial positions declined to 191,496 from 196,880 and short non-commercial positions fell to 197,634 from 208,136. The total non-commercial net position recovered slightly to -6,388 versus -11,256. The weekly closing price dropped to 1.1599 from 1.1608.
Indicator signals:
Trading is carried out in the area of 30 and 50 day moving averages, which jeopardizes the bearish trend.
Moving averages
Note: The period and prices of moving averages are considered by the author on the H1 hourly chart and differs from the general definition of the classic daily moving averages on the daily D1 chart.
Bollinger Bands
The volatility is very low, so you shouldn't be guided by this indicator yet.
Description of indicators
- Moving average (moving average, determines the current trend by smoothing out volatility and noise). Period 50. It is marked in yellow on the chart.
- Moving average (moving average, determines the current trend by smoothing out volatility and noise). Period 30. It is marked in green on the chart.
- MACD indicator (Moving Average Convergence/Divergence — convergence/divergence of moving averages) Quick EMA period 12. Slow EMA period to 26. SMA period 9
- Bollinger Bands (Bollinger Bands). Period 20
- Non-commercial speculative traders, such as individual traders, hedge funds, and large institutions that use the futures market for speculative purposes and meet certain requirements.
- Long non-commercial positions represent the total long open position of non-commercial traders.
- Short non-commercial positions represent the total short open position of non-commercial traders.
- Total non-commercial net position is the difference between short and long positions of non-commercial traders.


