empty
14.04.2023 12:52 AM
Technical analysis of GBP/USD for April 13, 2023

This image is no longer relevant

Overview :

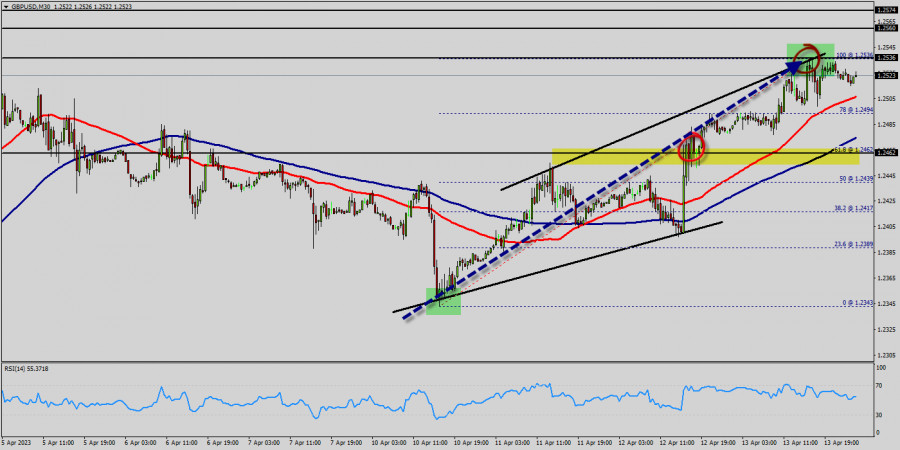
The GBPUSD pair traded with strong positivity yesterday to return to the bullish channel that appears on the chart, to head towards achieving expected additional gains in the upcoming sessions, targeting visiting 1.2522 level mainly. Therefore, we expect to witness more bullish bias in the upcoming sessions, noting that breaking 1.2462 and holding above it will stop the positive scenario and push the price to decline again.

The expected trading range for today is between 1.2462 support and 1.2560 resistance. The GBP/USD pair is going to continue to rise from the level of 1.2462 in the long term.

It should be noted that the support is established at the level of 1.2462 which represents the 61.8% Fibonacci retracement level on the M30 chart. The price is likely to form a double bottom in the same time frame. Accordingly, the GBP/USD pair is showing signs of strength following a breakout of the highest level of 1.2462.

So, buy above the level of 1.2462 with the first target at 1.2536 in order to test the daily resistance 1; and further to 1.2560.

Also, it might be noted that the level of 1.2560 is a good place to take profit because it will form a double top. The price is in a bullish channel now. In the Forex market, liquidity pertains to a currency pair's ability to be bought and sold at the current market price. Additionally, liquidity refers to market volatility and dynamics. Because the Forex market is colossal, it is also extremely liquid. Moreover, if a currency pair has high level of liquidity, it will be easier to trade.

On the other hand, in case a reversal takes place and the GBP/USD pair breaks through the support level of 1.2462, a further decline to 1.2343 can occur which would indicate a bearish market.

Trading recommendations :

The trend is still bullish as long as the price of 1.2463 is not broken. Thereupon, it would be wise to buy above the price of at 1.2463 with the primary target at 1.2536. Then, the GBP/USD pair will continue towards the second target at 1.2560.

In technical analysis: history usually repeats itself at certain level. So it will be of the wisdom to use historic rates to determine future prices. The technical analysis based only on the technical market data (quotes) with the help of various technical indicators. Moreover, in this book we will be touching on a variety of new techniques for applying numerical strategies, equations, formulas and probabilities. Additionally, we will be shared some of classical analysis such as breakout strategy and trend indicators. Alternative scenario : The breakdown of 1.2463 will allow the pair to go further down to the prices of 1.2403 and 1.2343.

เลือกช่วงเวลา
5
นาที
15
นาที
30
นาที
1
ชั่วโมง
4
ชั่วโมง
1
วัน
1
สัปดาห์
รับผลกำไรจากการเปลี่ยนแปลงอัตราสกุลเงินดิจิทัลกับ InstaForex.
ดาวน์โหลด MetaTrader 4 และเปิดการซื้อขายครั้งแรกของคุณ.
  • Grand Choice
    Contest by
    InstaForex
    InstaForex always strives to help you
    fulfill your biggest dreams.
    เข้าร่วมการแข่งขัน


บทความแนะนำ

สัญญาณการซื้อขายสำหรับ EUR/USD ระหว่างวันที่ 5-8 พฤษภาคม 2025: ขายต่ำกว่า 1.1370 (200 EMA - 6/8 Murray)

ในช่วงต้นของการซื้อขายในอเมริกา คู่สกุลเงิน EUR/USD ซื้อขายอยู่ที่ประมาณ 1.1345 ถึงจุดสูงสุดของช่องทางขาลงและแสดงสัญญาณของการอ่อนแรง ยูโรอาจกลับเข้าสู่รอบขาลงหากมันเสถียรที่ต่ำกว่า 1.1370 ในอีกไม่กี่วันข้างหน้า อาจจะเข้าถึงระดับ 6/8 Murray ที่ 1.1230 และในที่สุดถึง

Dimitrios Zappas 17:34 2025-05-05 UTC+2

สัญญาณการซื้อขายสำหรับทองคำ (XAU/USD) ในวันที่ 5-8 พฤษภาคม 2025: ซื้อหากราคาสูงกว่า $3,305 (21 SMA - 7/8 Murray)

ในช่วงต้นของเซสชันสหรัฐ ราคาทองคำกำลังซื้อขายอยู่ที่ประมาณ 3,322 โดยมีการเคลื่อนไหวขาขึ้นอย่างแข็งแกร่ง แผนภูมิ H4 แสดงให้เห็นว่ามันกำลังทะลุแนวโน้มทิศทางขาลงอยู่ หาก XAU/USD ยังคงเพิ่มขึ้นในอีกไม่กี่ชั่วโมงข้างหน้า เราคาดว่ามันสามารถยืนเหนือ 3,303 ได้ จากนั้นอาจไปถึงระดับ 7/8

Dimitrios Zappas 17:31 2025-05-05 UTC+2

EUR/USD: ผลการประชุมของ Fed อาจทำให้คู่สกุลเงินนี้ร่วงลง

คู่สกุลกำลังเคลื่อนไหวในกรอบแคบๆ ใต้ระดับแนวต้านที่ 1.1345 รอคอยผลการประชุมนโยบายการเงินของ Fed ซึ่งจะสรุปในวันพุธที่ 7 พฤษภาคม หาก Fed ตัดสินใจคงอัตราดอกเบี้ยหลักไว้ตามที่คาดการณ์ไว้ในขณะนี้ และแสดงความสงสัยเกี่ยวกับความเป็นไปได้ในการลดอัตราดอกเบี้ยในเดือนมิถุนายน คู่สกุลนี้อาจถูกกดดันและลดลงได้ ในแง่ของเทคนิค คู่สกุลนี้กำลังเคลื่อนไหวในกรอบด้านข้างระหว่าง

Pati Gani 10:59 2025-05-05 UTC+2

EUR/USD – 5 พฤษภาคม: ตลาดแรงงานสหรัฐฯ ยังคงมีความหวัง

เมื่อวันศุกร์ คู่ EUR/USD ขยับขึ้นไปถึงระดับ 1.1374 แล้วดีดตัวออกมา กลับเป็นการเสริมค่าให้กับดอลลาร์สหรัฐอีกครั้ง ฝ่ายหมีจู่โจมอีกครั้ง แต่เพียงระยะเวลาสั้น ๆ และโดยรวมแล้วพวกเขายังคงค่อนข้างอ่อนแอ ดังนั้น ตามสถานการณ์ปัจจุบัน แนวโน้มขาขึ้นยังคงอยู่ การดีดตัวใหม่จากระดับ

Samir Klishi 10:57 2025-05-05 UTC+2

GBP/USD – 5 พฤษภาคม: ทรัมป์อาจยกเลิกการเก็บภาษีกับจีน

ในกราฟรายชั่วโมง คู่สกุลเงิน GBP/USD ได้ลดลงต่อในวันศุกร์มุ่งหน้าสู่ระดับการปรับฐาน Fibonacci 161.8% ที่ 1.3249 การดีดตัวจากระดับนี้จะเป็นประโยชน์ต่อปอนด์อังกฤษและอาจนำไปสู่การเติบโตบางส่วนไปสู่ระดับ 1.3357 การปิดต่ำกว่าระดับ 1.3249 จะเพิ่มโอกาสในการลดลงต่อไปยังระดับ 1.3149 แนวโน้มขาขึ้นยังคงอยู่ในปัจจุบัน

Samir Klishi 10:51 2025-05-05 UTC+2

คาดการณ์ตลาด Forex วันที่ 05/05/2025: EUR/USD, GBP/USD, USD/JPY, USD/CHF, USD/CAD และ Bitcoin

ลิงก์ที่เป็นประโยชน์: บทความอื่นๆ ของฉันสามารถอ่านได้ในส่วนนี้ คอร์ส InstaForex สำหรับผู้เริ่มต้น การวิเคราะห์ยอดนิยม เปิดบัญชีการซื้อขาย สำคัญ: ผู้เริ่มต้นในตลาดซื้อขาย Forex ต้องระมัดระวังในการตัดสินใจเข้าตลาดเป็นอย่างมาก ก่อนการประกาศรายงานสำคัญ ควรหลีกเลี่ยงการเข้าตลาด เพื่อหลีกเลี่ยงการถูกจับอยู่ในสภาวะตลาดที่มีการแกว่งตัวรุนแรงเนื่องจากความผันผวนที่เพิ่มขึ้น

Sebastian Seliga 10:23 2025-05-05 UTC+2

การวิเคราะห์ทางเทคนิคของการเคลื่อนไหวของราคาภายในวันของเครื่องมือสินค้าโภคภัณฑ์ทองคำ, วันจันทร์ที่ 5 พฤษภาคม 2025

เมื่อปรากฏรูปแบบ Failing Wedge ในกราฟ 4 ชั่วโมง มันบ่งบอกว่าในอนาคตอันใกล้มีศักยภาพที่จะพุ่งไปสู่ระดับ 3297.43 และหากโมเมนตัมและความผันผวนอำนวย, ราคาทองคำจะเสริมความแข็งแกร่งอีกครั้งไปสู่ระดับ 3343.81 แต่หากในระหว่างทางไปสู่ระดับเหล่านี้ เกิดการแก้ไขการอ่อนตัวที่พุ่งผ่านและปิดต่ำกว่าระดับ 3201.44 ก็จะทำให้แผนการเสริมความแข็งแกร่งที่ได้กล่าวไว้ก่อนหน้าถูกยกเลิกและถือว่าเป็นโมฆะเองโดยอัตโนมัติ

Arief Makmur 08:23 2025-05-05 UTC+2

การวิเคราะห์ทางเทคนิคของการเคลื่อนไหวของราคาภายในวันสำหรับคู่สกุลเงินข้าม EUR/JPY, วันจันทร์ที่ 5 พฤษภาคม 2025

หากพิจารณากราฟ 4 ชั่วโมงของคู่เงิน EUR/JPY ดูเหมือนว่าในอนาคตอันใกล้ EUR/JPY มีแนวโน้มที่จะแข็งค่าขึ้น ซึ่งได้รับการยืนยันจากการปรากฏของรูปแบบ Convergence ระหว่างการเคลื่อนไหวของราคาคู่เงิน EUR/JPY กับตัวชี้วัด Stochastic Oscillator และการเคลื่อนไหวของราคาคู่เงิน

Arief Makmur 08:23 2025-05-05 UTC+2

การวิเคราะห์ทางเทคนิคการเคลื่อนไหวของราคารายวัน ดัชนี Nasdaq 100 วันศุกร์ที่ 2 พฤษภาคม 2025

จากที่เห็นในกราฟ 4 ชั่วโมงของดัชนี Nasdaq 100 ตัวชี้วัด Stochastic Oscillator อยู่ในสภาวะขาย (Crossing SELL) และปรากฏรูปแบบ Rising Wedge ดังนั้นตามเงื่อนไขสองข้อนี้

Arief Makmur 08:04 2025-05-02 UTC+2

สัญญาณการซื้อขายสำหรับทองคำ (XAU/USD) สำหรับวันที่ 1-3 พฤษภาคม 2025: ซื้อเมื่อราคาสูงกว่า $3,203 (200 EMA - 5/8 Murray)

ในช่วงต้นของตลาดอเมริกา ราคาทองคำซื้อขายอยู่ที่ประมาณ 3,223 ปรับตัวขึ้นหลังจากที่ลงมาถึงระดับต่ำสุดของ 5/8 Murray ประมาณ 3,203 คาดว่าทองคำจะยังคงฟื้นตัวต่อไปในอีกไม่กี่ชั่วโมงข้างหน้า อย่างไรก็ตาม เราอาจคาดว่าน่าจะมีการปรับฐานเกิดขึ้น เนื่องจากราคาเครื่องมือทางเทคนิคนี้ดูเหมือนจะอยู่ในสถานะที่ขายมากเกินไป ราคาทองคำอาจซื้อขายอยู่ระหว่าง 3,203 และอาจลงมาถึงก้นช่องขาลงที่ประมาณ

Dimitrios Zappas 17:49 2025-05-01 UTC+2
หากไม่สะดวกคุยในตอนนี้
ระบุคำถามไว้ได้ใน แชท.
Widget callback
 

Dear visitor,

Your IP address shows that you are currently located in the USA. If you are a resident of the United States, you are prohibited from using the services of InstaFintech Group including online trading, online transfers, deposit/withdrawal of funds, etc.

If you think you are seeing this message by mistake and your location is not the US, kindly proceed to the website. Otherwise, you must leave the website in order to comply with government restrictions.

Why does your IP address show your location as the USA?

  • - you are using a VPN provided by a hosting company based in the United States;
  • - your IP does not have proper WHOIS records;
  • - an error occurred in the WHOIS geolocation database.

Please confirm whether you are a US resident or not by clicking the relevant button below. If you choose the wrong option, being a US resident, you will not be able to open an account with InstaForex anyway.

We are sorry for any inconvenience caused by this message.