empty
20.03.2023 02:04 PM
Technical analysis of GBP/USD for March 20, 2023

This image is no longer relevant

Overview :

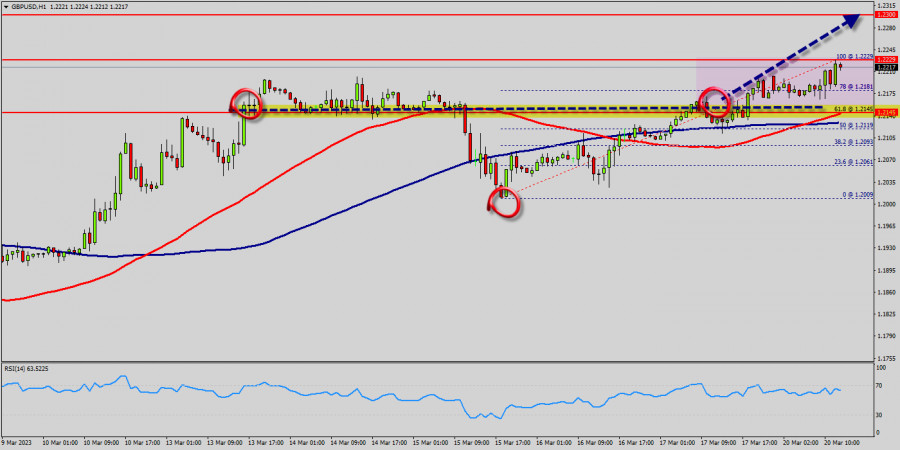
The GBP/USD pair traded higher and closed the day in the positive territory near the price of 1.2208. Right now, it was trading in a narrow range of 1.2150 staying close to a 2-days high. On the hourly chart, the GBP/USD pair is still trading above the MA (100) H1 moving average line (1.2068 - weekly pivot point). The situation is similar on the 4-hour chart. Based on the foregoing, it is probably worth sticking to the north direction in trading, and as long as the GBP/USD pair remains above MA 100 H1, it may be necessary to look for entry points to buy for the formation of a correction.

All elements being clearly bullish, it would be possible for traders to trade only long positions on the GBP/USD pair as long as the price remains well above the golden ratio of 1.2068. The buyers' bullish objective is set at 1.2209.

The price is likely to form a double top in the same time frame. Accordingly, the GBP/USD pair is showing signs of strength following a breakout of the highest level of 1.2209. So, buy above the level of 1.2068 with the first target at 1.2209 in order to test the daily resistance 1. The level of 1.2209 is a good place to take profits.

Moreover, the RSI is still signaling that the trend is upward as it remains strong above the moving average (100). This suggests that the pair will probably go up in coming hours. A bullish break in this resistance would boost the bullish momentum. Other outlook for the GBP/USD pair : Pound Sterling is currently trading at 1.2150. If the trend reverses from this point, then a possible future share price target could be 1.2209.

If the price of Pound Sterling is trading above 1.2150 then possibility of upside targets getting achieved is higher around the level of 1.2150. The basic bullish trend is very strong on the GBP/USD pair, but the short term shows some signs of running out of steam. Nevertheless, a purchase could be considered as long as the price remains above 1.2150.

Crossing the first resistance at 1.2209 would be a sign of a potential new surge in the price. Buyers would then use the next resistance located at 1.2270 as an objective. Crossing it would then enable buyers to target 1.2270. Caution, a return to below 1.2270 would be a sign of a consolidation phase in the short-term basic trend. If this is the case, remember that trading against the trend may be riskier.

It would seem more appropriate to wait for a signal indicating reversal of the trend. In the very short term, the general bullish sentiment is not called into question, despite technical indicators being indecisive. All elements being clearly bullish market, it would be possible for traders to trade only long positions on the GBP/USD pair as long as the price remains well above the price of 1.2068. The GBP/USD pair will continue rising from the level of 1.2068 in the long term.

It should be noted that the support is established at the level of 1.2068 which represents the last bearish wave. The price is likely to form a double bottom in the same time frame. Accordingly, the GBP/USD pair is showing signs of strength following a breakout of the highest level of 1.2068. So, buy above the level of 1.2068 with the first target at 1.2209 in order to test the daily resistance 1. The buyers' bullish objective is set at the level of 1.2270 (last bullish wave). A bullish break in this resistance would boost the bullish momentum.

The buyers could then target the resistance located at 1.2270 . This suggests that the pair will probably go up in coming hours. If the trend is able to break the level of 1.2209 (double top), then the market will call for a strong bullish market towards the objective of 1.2270 this week. If there is any crossing, the next objective would be the resistance located at 1.2270.

The level of 1.2270 is a good place to take profits. Moreover, the RSI is still signaling that the trend is upward as it remains strong above the moving average (100). Since the trend is above the 61.8% Fibonacci level (1.2068), it means the market is still in a uptrend. From this point, the GBP/USD pair is continuing in a bullish trend from the new support of 1.2068. This is shown to us as the current price is in a bullish channel.

According to the previous events, we expect that the GBP/USD pair will move between 1.2068 and 1.2270 in coming hours. It is also should be noted, beware of bullish excesses that could lead to a possible short-term correction; but this possible correction would not be tradeable.

On the other hand, in case a reversal takes place and the GBP/USD pair breaks through the support level of 1.2068, a further decline to 1.1981 can occur. It would indicate a bearish market.

เลือกช่วงเวลา
5
นาที
15
นาที
30
นาที
1
ชั่วโมง
4
ชั่วโมง
1
วัน
1
สัปดาห์
รับผลกำไรจากการเปลี่ยนแปลงอัตราสกุลเงินดิจิทัลกับ InstaForex.
ดาวน์โหลด MetaTrader 4 และเปิดการซื้อขายครั้งแรกของคุณ.
ข่าวสารจากตลาดสหรัฐประจำวันที่ 12 พฤษภาคม ดัชนีหุ้นสหรัฐได้เพิ่มขึ้นด้วยความหวังเกี่ยวกับความก้าวหน้าในการเจรจาการค้าระหว่างวอชิงตันกับปักกิ่ง นักลงทุนหวังว่าข้อตกลงในที่สุดอาจช่วยผ่อนคลายความตึงเครียดทางภูมิรัฐศาสตร์และกระตุ้นตลาดใหม่ อย่างไรก็ตาม นักวิเคราะห์เตือนว่าการปรับฐานใน S&P 500 ยังคงเป็นไปได้ โดยเฉพาะหากกำไรของบริษัทต่าง ๆ ยังคงอ่อนแอลง ความเป็นไปได้ของการเติบโตของกำไรที่ช้าลงในบริษัทสหรัฐอาจเป็นอุปสรรคต่อการประเมินมูลค่าหุ้นที่สูงขึ้น ดูรายละเอียดเพิ่มเติม ที่นี่ . สัปดาห์การซื้อขายใหม่เริ่มต้นด้วยบรรยากาศที่เป็นบวก
  • Grand Choice
    Contest by
    InstaForex
    InstaForex always strives to help you
    fulfill your biggest dreams.
    เข้าร่วมการแข่งขัน


บทความแนะนำ

การพยากรณ์ Forex วันที่ 12/05/2025 สำหรับคู่เงิน EUR/USD, GBP/USD, USD/CHF, USD/JPY, ทองคำ และ Bitcoin

ลิงค์ที่มีประโยชน์: บทความอื่นๆ ของฉันสามารถอ่านได้ในส่วนนี้ หลักสูตร InstaForex สำหรับผู้เริ่มต้น การวิเคราะห์ยอดนิยม เปิดบัญชีการซื้อขาย สำคัญ: ผู้เริ่มต้นในการเทรด Forex จำเป็นต้องระมัดระวังในการตัดสินใจก่อนที่จะเข้าตลาดให้มากที่สุด ก่อนการประกาศรายงานสำคัญ ควรหลีกเลี่ยงการทำธุรกรรมเพื่อป้องกันการถูกกระทบจากความผันผวนของตลาดที่เกิดขึ้นอย่างรวดเร็ว หากคุณตัดสินใจที่จะทำธุรกรรมในช่วงที่มีข่าวประกาศ

Sebastian Seliga 13:37 2025-05-12 UTC+2

EUR/USD. 12 พฤษภาคม ความขัดแย้งในยูเครนอาจได้รับการแก้ไข

สวัสดีครับ/ค่ะ ท่านนักเทรดที่เคารพ! เมื่อวันศุกร์ คู่สกุลเงิน EUR/USD ได้ขยับขึ้นถึงแนวต้านที่ 1.1265–1.1282 แล้วเด้งกลับและพลิกแพลงไปในทิศทางที่เอื้อให้กับดอลลาร์สหรัฐ การเคลื่อนที่ลงอาจดำเนินต่อไปในวันนี้สู่ระดับ 127.2% ของ Fibonacci ที่ 1.1181 หากมีการดีดตัวจากระดับนี้

Samir Klishi 10:04 2025-05-12 UTC+2

GBP/USD. 12 พฤษภาคม ข้อตกลงการค้าครั้งแรกของทรัมป์

สวัสดีครับ/ค่ะ เทรดเดอร์ทุกท่าน! ในกราฟรายชั่วโมง คู่สกุลเงิน GBP/USD เมื่อวันศุกร์ที่ผ่านมาเกือบเกิดการดีดตัวจากระดับ 100.0% Fibonacci ที่ 1.3205 ส่งผลให้เกิดการกลับทิศทางเป็นเหมือนเดิมในฝั่งของปอนด์อังกฤษและการเติบโตไปสู่โซนแนวต้านที่ 1.3344–1.3357 การดีดตัวจากโซนนี้ในวันนี้จะสนับสนุนดอลลาร์และต่อเนื่องไปยังการลดลงไปสู่ระดับ 100.0% Fibonacci

Samir Klishi 10:04 2025-05-12 UTC+2

สัญญาณการซื้อขายสำหรับทองคำวันที่ 9-12 พฤษภาคม 2025: ขายต่ำกว่า $3,361 (21 SMA - 7/8 Murray)

ต้นช่วงการซื้อขายของตลาดอเมริกา ราคาทองคำกำลังซื้อขายที่ประมาณ 3,330 ซึ่งต่ำกว่าค่าเฉลี่ยเคลื่อนที่อย่างง่าย (SMA) 21 วัน และกำลังมีการฟื้นตัวหลังจากราคาลงถึงระดับ 6/8 ของมูเรย์ที่ราว 3,281 ทองคำอาจจะยังคงมีแนวโน้มที่จะเพิ่มขึ้นในอีกไม่กี่วันข้างหน้าและอาจจะขึ้นถึงระดับ 7/8 ของมูเรย์ที่ 3,361

Dimitrios Zappas 15:01 2025-05-09 UTC+2

การคาดการณ์สำหรับ EUR/USD ในวันที่ 9 พฤษภาคม 2025

เมื่อวันพฤหัสบดีที่ผ่านมา คู่เงิน EUR/USD ได้ฟื้นตัวจากระดับฟีโบนักชี 76.4% ที่ 1.1338 และเริ่มเคลื่อนที่ไปในทิศทางที่เป็นประโยชน์ต่อดอลลาร์สหรัฐ โดยลดลงต่ำกว่าโซนแนวรับที่ระดับ 1.1240–1.1265 การฟื้นตัวจากระดับนี้ในวันนี้จะส่งสัญญาณถึงการลดลงต่อเนื่องไปยังระดับ 1.1182 และ 1.1074 ในทางกลับกัน

Samir Klishi 11:24 2025-05-09 UTC+2

GBP/USD. วันที่ 9 พฤษภาคม ธนาคารกลางอังกฤษไม่ได้ส่งเสริมตลาดกระทิง

บนกราฟรายชั่วโมง คู่เงิน GBP/USD ในวันพฤหัสบดีที่ผ่านมามีการดีดตัวสองครั้งจากระดับการปรับฐาน Fibonacci ที่ 127.2% ที่ 1.3344 หมุนไปในทิศทางที่เป็นผลดีต่อเงินดอลลาร์สหรัฐ และร่วงลงสู่ระดับ Fibonacci 100.0% ที่ 1.3205

Samir Klishi 11:22 2025-05-09 UTC+2

การพยากรณ์ฟอเร็กซ์ 09/05/2025: EUR/USD, USD/JPY, ทองคำ, Ethereum และ Bitcoin

ลิงก์ที่มีประโยชน์: บทความอื่นๆ ของฉันสามารถอ่านได้ในส่วนนี้ หลักสูตรสำหรับผู้เริ่มต้นของ InstaForex บทวิเคราะห์ยอดนิยม เปิดบัญชีซื้อขาย ข้อสำคัญ: ผู้เริ่มต้นในการซื้อขายฟอเร็กซ์จำเป็นต้องระมัดระวังอย่างมากเมื่อทำการตัดสินใจเกี่ยวกับการเข้าสู่ตลาด ก่อนที่จะมีการเปิดเผยรายงานสำคัญ ควรที่จะอยู่ห่างจากตลาดเพื่อลดความเสี่ยงจากการเผชิญกับความผันผวนของตลาดที่สูงขึ้น หากคุณตัดสินใจที่จะทำการซื้อขายในช่วงที่มีการเปิดเผยข่าว ควรที่จะตั้งคำสั่งหยุดการขาดทุนเสมอเพื่อที่จะลดการสูญเสีย หากไม่ตั้งคำสั่งหยุดการขาดทุน คุณอาจสูญเสียเงินฝากทั้งหมดได้อย่างรวดเร็ว

Sebastian Seliga 09:53 2025-05-09 UTC+2

สัญญาณการซื้อขายสำหรับ EUR/USD วันที่ 8-12 พฤษภาคม 2025: ซื้อเมื่อราคาสูงกว่า 1.1190 (200 EMA - 6/8 Murray)

ในช่วงต้นของการซื้อขายตลาดยุโรป ค่าเงิน EUR/USD กำลังซื้อขายอยู่ราวๆ 1.1224 เหนือเส้น 200 EMA และอยู่ต่ำกว่า 6/8 Murray โดยมีแนวโน้มขาลง ค่าเงินยูโรน่าจะยังคงร่วงลงในอีกไม่กี่ชั่วโมงข้างหน้า จนกว่าจะถึงจุดต่ำสุดของช่องแนวโน้มประมาณ 1.1078

Dimitrios Zappas 06:41 2025-05-09 UTC+2

คาดการณ์ EUR/USD สำหรับวันที่ 9 พฤษภาคม 2025

ข้อมูลจากเยอรมันเมื่อวานนี้ดีกว่าที่คาดไว้ การผลิตในภาคอุตสาหกรรมในเดือนมีนาคมเพิ่มขึ้น 3.0% เมื่อเทียบกับการคาดการณ์ที่ 0.9% และการลดลงในเดือนกุมภาพันธ์ที่ 1.3% ส่วนเกินดุลการค้าเดือนมีนาคมอยู่ที่ 21.1 พันล้านยูโร ซึ่งสูงกว่าที่คาดการณ์ไว้ที่ 19.0 พันล้านยูโร ความต้องการความเสี่ยงยังคงแข็งแกร่งในตลาดหุ้น

Laurie Bailey 05:55 2025-05-09 UTC+2

การคาดการณ์ GBP/USD สำหรับวันที่ 9 พฤษภาคม 2025

เมื่อวานนี้ ธนาคารแห่งประเทศอังกฤษได้ปรับลดอัตราดอกเบี้ยลงหนึ่งในสี่เปอร์เซ็นต์ โดยมีเพียงสมาชิกเจ็ดคนของคณะกรรมการที่ลงคะแนนเห็นด้วยกับการตัดสินใจนี้ ซึ่งขัดกับที่คาดการณ์ไว้ว่า สมาชิกทั้งเก้าคนจะสนับสนุนอย่างเป็นเอกฉันท์ ตามที่เราได้คาดการณ์ไว้ในการวิเคราะห์เมื่อวานนี้ ตลาดไม่ได้เตรียมพร้อมสำหรับการลดอัตราดอกเบี้ยในครั้งนี้ ส่งผลให้ค่าเงินปอนด์ลดลง 46 พิพในตอนท้ายของวัน ขณะนี้ราคาอยู่ในช่วงทดสอบระดับเป้าหมายที่ 1.3184–1.3208 การที่ราคาแตกทะลุขอบล่างจะส่งผลให้ราคาอาจปรับตัวลดลงต่อไปยังระดับเป้าหมายที่ 1.3101 เส้น

Laurie Bailey 05:15 2025-05-09 UTC+2
หากไม่สะดวกคุยในตอนนี้
ระบุคำถามไว้ได้ใน แชท.
Widget callback
 

Dear visitor,

Your IP address shows that you are currently located in the USA. If you are a resident of the United States, you are prohibited from using the services of InstaFintech Group including online trading, online transfers, deposit/withdrawal of funds, etc.

If you think you are seeing this message by mistake and your location is not the US, kindly proceed to the website. Otherwise, you must leave the website in order to comply with government restrictions.

Why does your IP address show your location as the USA?

  • - you are using a VPN provided by a hosting company based in the United States;
  • - your IP does not have proper WHOIS records;
  • - an error occurred in the WHOIS geolocation database.

Please confirm whether you are a US resident or not by clicking the relevant button below. If you choose the wrong option, being a US resident, you will not be able to open an account with InstaForex anyway.

We are sorry for any inconvenience caused by this message.