Analysis of EUR/USD and trading tips
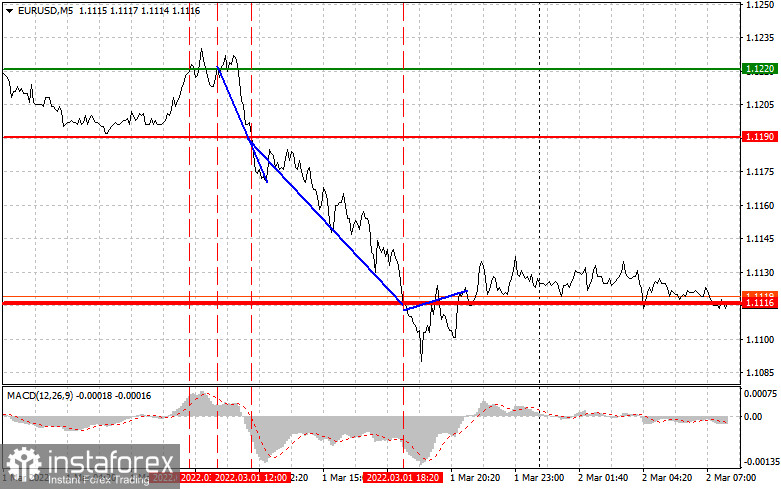
Yesterday, the euro/dollar pair tested the level of 1.1220 for the first time, when the MACD indicator was far from the zero level, thus capping the upward momentum. That is why traders avoided entering the market. Some time later, the price tested the mentioned level once again.By that moment, the MACD indicator was in the overbought area and began falling. As a result, scenario 2, which presupposes sell orders on the euro, was implemented. The pair lost around 30 pips. The moment when the price tested 1.1190 did not meet the moment when the MACD indicator started sliding from the zero level. However, strong bearish sentiment allowed the pair to drop deeper. Thus, the pair lost 80 pips. The pair failed to show a rapid rise after it touched 1.1116.
Yesterday's speech provided by ECB's President Christine Lagarde failed to affect the market. However, weak data on Germany's, Italy's, and eurozone's manufacturing PMI prevented the euro from upward correction. Meanwhile, strong data on the US ISM manufacturing PMI boosted the greenback. The US currency was also supported by a possible capture of Kiev by the Russian army.
This day is quite rich in macroeconomic events. Early today, Germany will disclose its figures on the unemployment rate and the number of unemployed people. Weak data may cause a drop in the euro at the beginning of the European session. Notably, the eurozone CPI data will be of greater importance. In February, inflation may surge to 5.4% on a yearly basis. It is a crucial factor for the ECB that has met a lot of difficulties adapting its monetary policy to the current geopolitical situations.
Speeches provided by member of the Governing Council of the ECB Joachim Nagel and Vice-President of the ECB Luis de Guindos will hardly attract traders' attention. They are unlikely to say anything new. Later, all eyes will be turned to the ADP non-farm employment change data and speech delivered by Fed Chair Jerome Powell. His comments are likely to determine the greenback's trend in the near future. Jerome Powell is likely to unveil the regulator's plans for March. The Fed is expected to change its stance amid the ongoing conflict in Ukraine. The US dollar may advance against risky assets.
Signals to buy EUR/USD
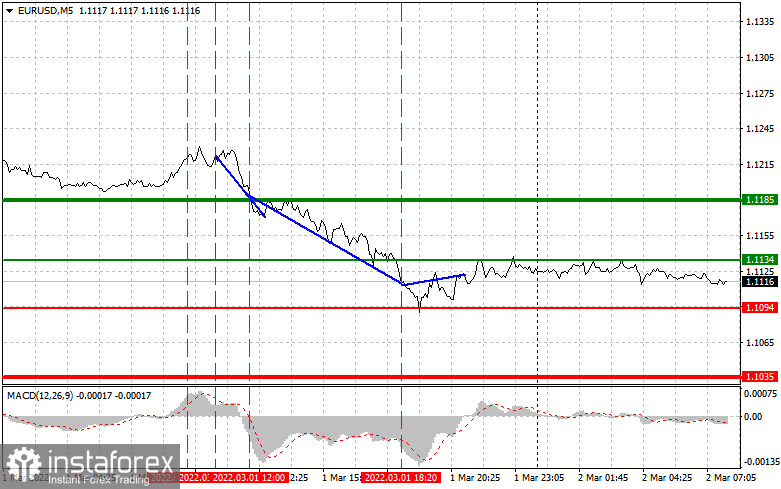
Scenario 1: today, it is possible to buy the euro, when it hits 1.1134 (a green line) with the target at 1.1185. There, it is recommended to leave the market and sell the euro, expecting a drop of 10-15 pips. The euro will hardly show a strong rise today. However, high inflation in the eurozone may force the ECB to change its policy. This will provide a mid-term signal of the euro's appreciation against the US dollar, if tension in Ukraine becomes weaker. Other reports from the eurozone will be of secondary importance since traders will shift their attention to Jerome Powell's speech. Importantly, before buying the euro, make sure that the MACD indicator is above the zero level and has just started its rise from it.
Scenario 2: it is also possible to buy the euro after it hits 1.1094. At that moment, the MACD indicator should be in the overbought area. This will cap the upward potential of the pair and may cause the market reversal. The euro may climb to 1.1134 and 1.1185.
Signals to sell EUR/USD:
Scenario 1: it is possible to sell the euro after it touches 1.1094 (a red line). The target is located at 1.1035, where it is recommended to leave the market and open buy positions, expecting a rise of 10-15 pips. Deterioration in the Russia-Ukraine conflict may add to the bearish sentiment. Importantly, before starting selling the euro, make sure that the MACD indicator is below the zero line and has just started a decline from it.
Scenario 2: traders may also sell the euro, if the price tests 1.1134. At that moment, the MACD indicator should be in the overbought area, thus limiting the pair's upward momentum and causing the market reversal. The price may slide to 1.1094 and 1.1035.
What we see on the trading charts:
A thin green line is the entry price at which you can buy a trading instrument.
A thick green line is the estimated price where you can place a take-profit order or lock in profits by yourself, since the price will hardly go above this level.
A thin red line is the entry price at which you can sell the trading instrument.
A thick red line is the estimated price where you can place a take-profit order or lock in profits by yourself, since the price is unlikely to decline further.
The MACD indicator. When entering the market, it is important to take into account overbought and oversold zones.
Beginning traders should be very cautious when making decisions to enter the market. It is better to open positions ahead of the publication of important reports in order to avoid price fluctuations. If you decide to enter the market amid the news release, place stop orders to minimize losses. Otherwise, you may lose all your funds, especially if you do not use money management and trade big volumes.
Please remember that successful trading requires an accurate trading plan similar to the one described above. Knee-jerk decisions made amid the current market situation is a losing strategy of an intraday trader.