Analyzing Friday's trades:
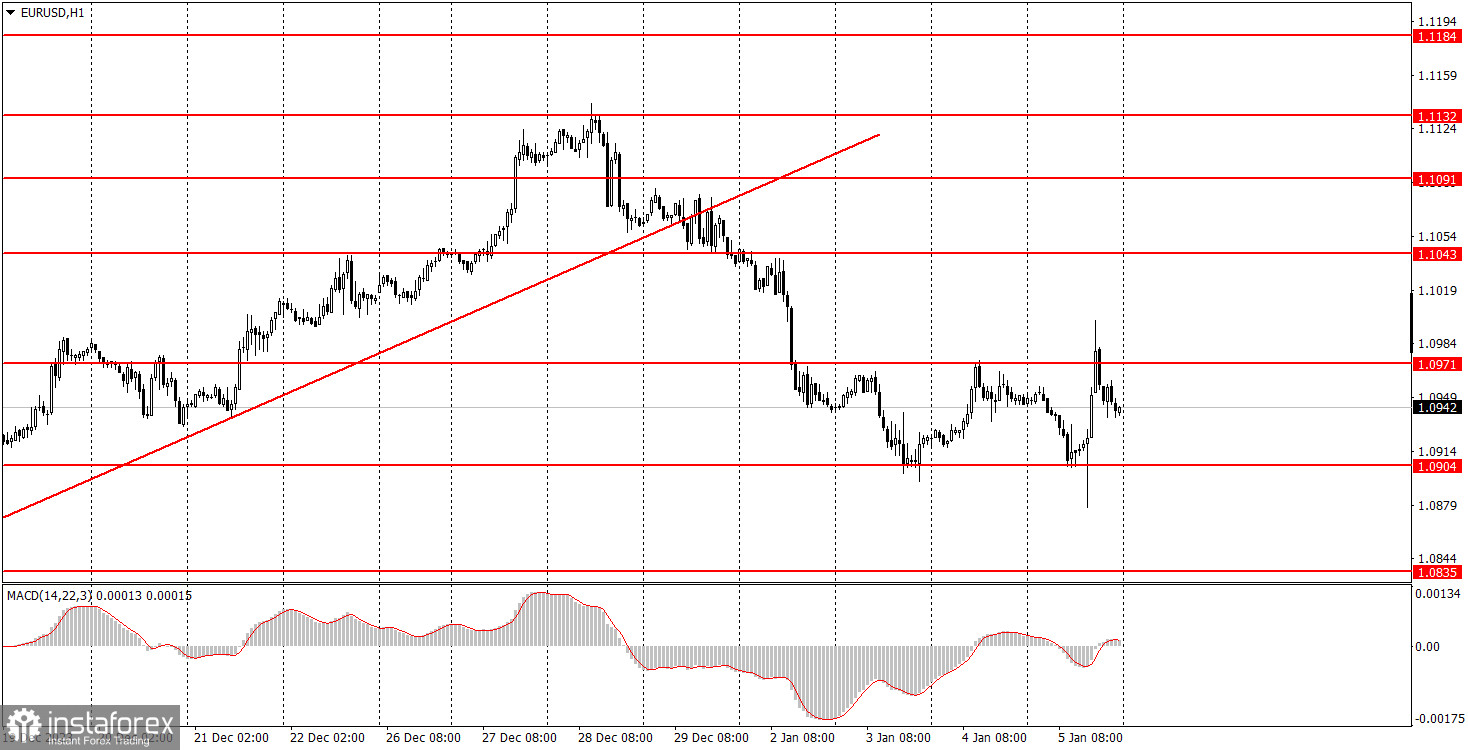
EUR/USD on 30M chart
EUR/USD both fell and soared during Friday's trading session. The price fell in the first half of the day, and showed sharp growth in the second half. We believe that the economic reports triggered such movements. So, what exactly happened on Friday, and why couldn't the dollar strengthen once again?
The annual rate of inflation in the eurozone rose to 2.9% in December, against market expectations for a 3.0% reading. How should we interpret this report? The euro was declining in the morning, so the market probably believed that the 2.9% result does not necessarily mean that the European Central Bank officials will become increasingly hawkish. And we agree with this conclusion.
Next, the U.S. NonFarm Payrolls report was released, which exceeded expectations, similar to the earlier ADP report. The dollar edged up after this report but then it started a more significant downward move. What does this mean? The U.S. currency fell when it should have grown. We have observed such illogical movements for a while now. It's worth noting that the unemployment rate for December was expected to be between 3.8% and 3.9%, but it actually stood at 3.7%. This could have been another reason to buy the dollar rather than sell it.
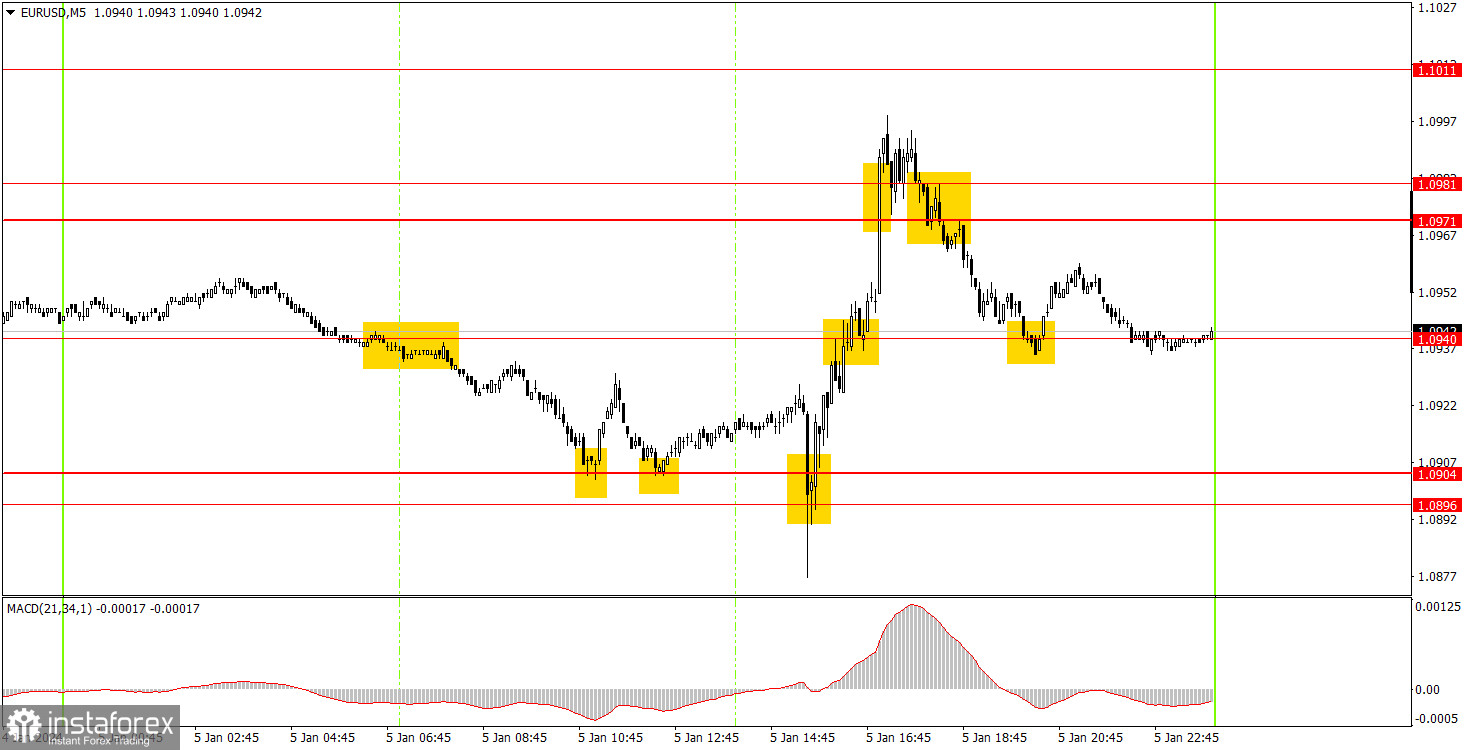
EUR/USD on 5M chart
On the 5-minute chart, several trading signals were generated. In the first half of the day, a sell signal around the 1.0940 level led to a drop to 1.0904. Two rebounds from the 1.0904 level allowed us to open a long position, but before the release of U.S. reports, traders should have placed a stop loss to break-even on this trade, which eventually worked. The next buy signal in the range of 1.0896-1.0904 was formed exactly when the Nonfarm Payrolls and unemployment data were published. It's hard to say whether newcomers should have executed this signal, but they had the opportunity to enter the market. The rise lasted for 70 pips. Another sell signal in the range of 1.0971-1.0981 also turned out to be profitable. In the end, at least three trades made it possible for us to earn good profits.
Trading tips on Monday:
On the hourly chart, EUR/USD finally has a chance to form a downtrend. A plethora of important U.S. reports did not provide strong support for the greenback, but the downtrend persists. Perhaps the pair needs to enter a minor bullish correction before it goes back to falling again.
On Monday, we will base our trades on the range between 1.0904-1.0971. The pair has tested each of the boundaries of this range twice, so for now, we have a flat phase. The pair's direction depends on which boundary the price ultimately breaks through.
The key levels on the 5M chart are 1.0733, 1.0767-1.0781, 1.0835, 1.0896-1.0904, 1.0940, 1.0971-1.0981, 1.1011, 1.1043, 1.1091, 1.1132-1.1145, 1.1184, 1.1241, 1.1279-1.1292. On Monday, we can only highlight the eurozone retail sales data. This is a relatively minor report, so we may observe a flat phase during the day.
Basic trading rules:
1) Signal strength is determined by the time taken for its formation (either a bounce or level breach). A shorter formation time indicates a stronger signal.
2) If two or more trades around a certain level are initiated based on false signals, subsequent signals from that level should be disregarded.
3) In a flat market, any currency pair can produce multiple false signals or none at all. In any case, the flat trend is not the best condition for trading.
4) Trading activities are confined between the onset of the European session and mid-way through the U.S. session, post which all open trades should be manually closed.
5) On the 30-minute timeframe, trades based on MACD signals are only advisable amidst substantial volatility and an established trend, confirmed either by a trend line or trend channel.
6) If two levels lie closely together (ranging from 5 to 15 pips apart), they should be considered as a support or resistance zone.
How to read charts:
Support and Resistance price levels can serve as targets when buying or selling. You can place Take Profit levels near them.
Red lines represent channels or trend lines, depicting the current market trend and indicating the preferable trading direction.
The MACD(14,22,3) indicator, encompassing both the histogram and signal line, acts as an auxiliary tool and can also be used as a signal source.
Significant speeches and reports (always noted in the news calendar) can profoundly influence the price dynamics. Hence, trading during their release calls for heightened caution. It may be reasonable to exit the market to prevent abrupt price reversals against the prevailing trend.
Beginning traders should always remember that not every trade will yield profit. Establishing a clear strategy coupled with sound money management is the cornerstone of sustained trading success.