Analyzing Wednesday's trades:
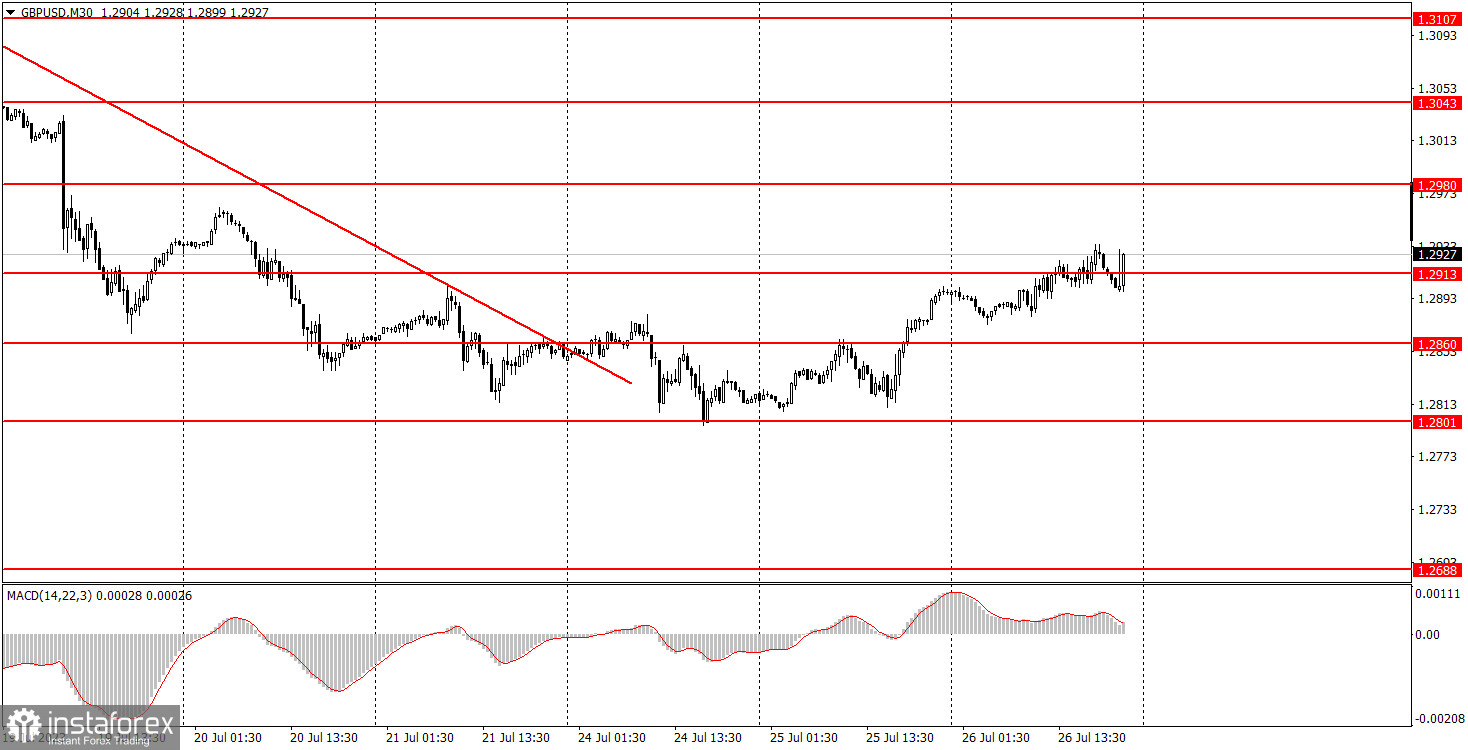
GBP/USD on 30M chart
The GBP/USD pair continued to reverse up on Wednesday, which started the day before. There were no reasons to buy the British pound during the day, since both the UK and the US did not release any significant report. Then the pound sterling traded higher in the evening, but it could quickly end as the market is currently trading impulsively, driven by emotions. By Thursday morning, the pair could move in the opposite direction. Nevertheless, from a technical perspective, the pair has started to correct, and this corrective phase may continue. Of course, now a lot will depend on the Bank of England's decisions next week, but the pound could still make a move towards a new stage in its long-term uptrend, which has been going on for 10 months.
We still believe that there are no compelling reasons for the pound to rise further, but the market thinks otherwise. It is essential to follow the market. Moreover, when trading intraday, the general trend is not of utmost importance.
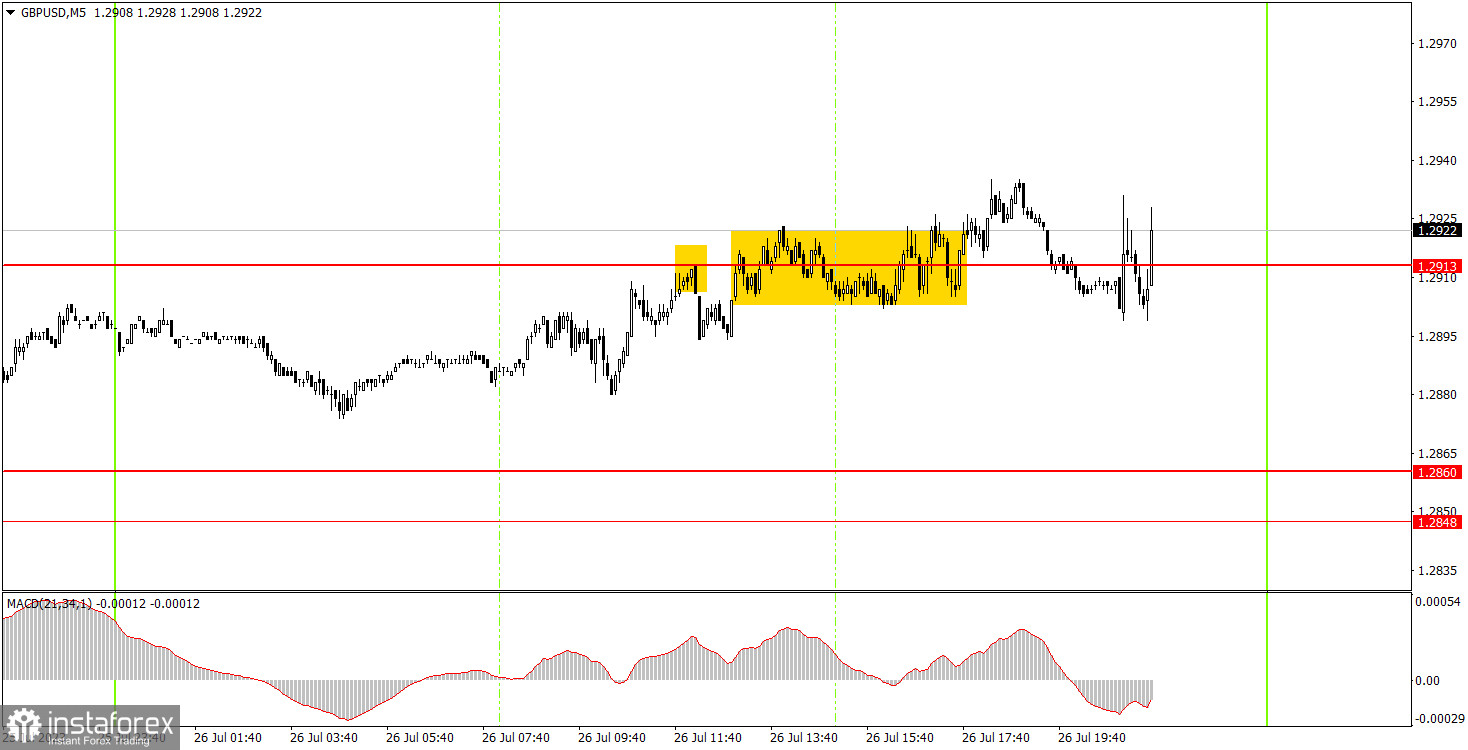
GBP/USD on 5M chart
If we look at the 5-minute chart, we can see that the pair moved in quite a chaotic manner, with volatility just at 60 pips, which is very low for the pound. Naturally, market activity increased in the evening, but only slightly, and beginners should no longer have been interested in taking positions by that time. The trading signals were bad. As shown in the illustration above, trading was practically flat all day. Therefore, beginners might have tried to work with the bounce from the level of 1.2913, which did not bring them any profit or loss, as the price stalled there and simply continued to move along the level of 1.2913. It was wise to close any positions before the evening and leave the market.
Trading tips on Thursday:
On the 30-minute chart, the GBP/USD pair started a bullish correction, and now the key is to confirm that it is indeed a correction and not a new trend, which will be challenging to justify fundamentally. The Federal Reserve raised its interest rate to 5.5%, but the dollar fell. Of course, one can assume that the market had already anticipated this decision. But now, let's focus on the pound, since the market has already priced in the BoE's decision. The key levels on the 5M chart are 1.2653, 1.2688, 1.2748, 1.2801, 1.2848-1.2860, 1.2913, 1.2981-1.2993, 1.3043, 1.3107, 1.3145. Once the price moves 20 pips in the right direction after opening a trade, you can set the stop-loss at breakeven. On Thursday, there are no significant events lined up in the UK. The US will release significant reports on GDP for the second quarter and Durable Goods Orders.
Basic trading rules:
1) The strength of the signal depends on the time period during which the signal was formed (a rebound or a break). The shorter this period, the stronger the signal.
2) If two or more trades were opened at some level following false signals, i.e. those signals that did not lead the price to Take Profit level or the nearest target levels, then any consequent signals near this level should be ignored.
3) During the flat trend, any currency pair may form a lot of false signals or do not produce any signals at all. In any case, the flat trend is not the best condition for trading.
4) Trades are opened in the time period between the beginning of the European session and until the middle of the American one when all deals should be closed manually.
5) We can pay attention to the MACD signals in the 30M time frame only if there is good volatility and a definite trend confirmed by a trend line or a trend channel.
6) If two key levels are too close to each other (about 5-15 pips), then this is a support or resistance area.
How to read charts:
Support and Resistance price levels can serve as targets when buying or selling. You can place Take Profit levels near them.
Red lines are channels or trend lines that display the current trend and show which direction is better to trade.
MACD indicator (14,22,3) is a histogram and a signal line showing when it is better to enter the market when they cross. This indicator is better to be used in combination with trend channels or trend lines.
Important speeches and reports that are always reflected in the economic calendars can greatly influence the movement of a currency pair. Therefore, during such events, it is recommended to trade as carefully as possible or exit the market in order to avoid a sharp price reversal against the previous movement.
Beginners should remember that every trade cannot be profitable. The development of a reliable strategy and money management are the key to success in trading over a long period of time.