Analysis of Monday's deals:
30M chart of the EUR/USD pair
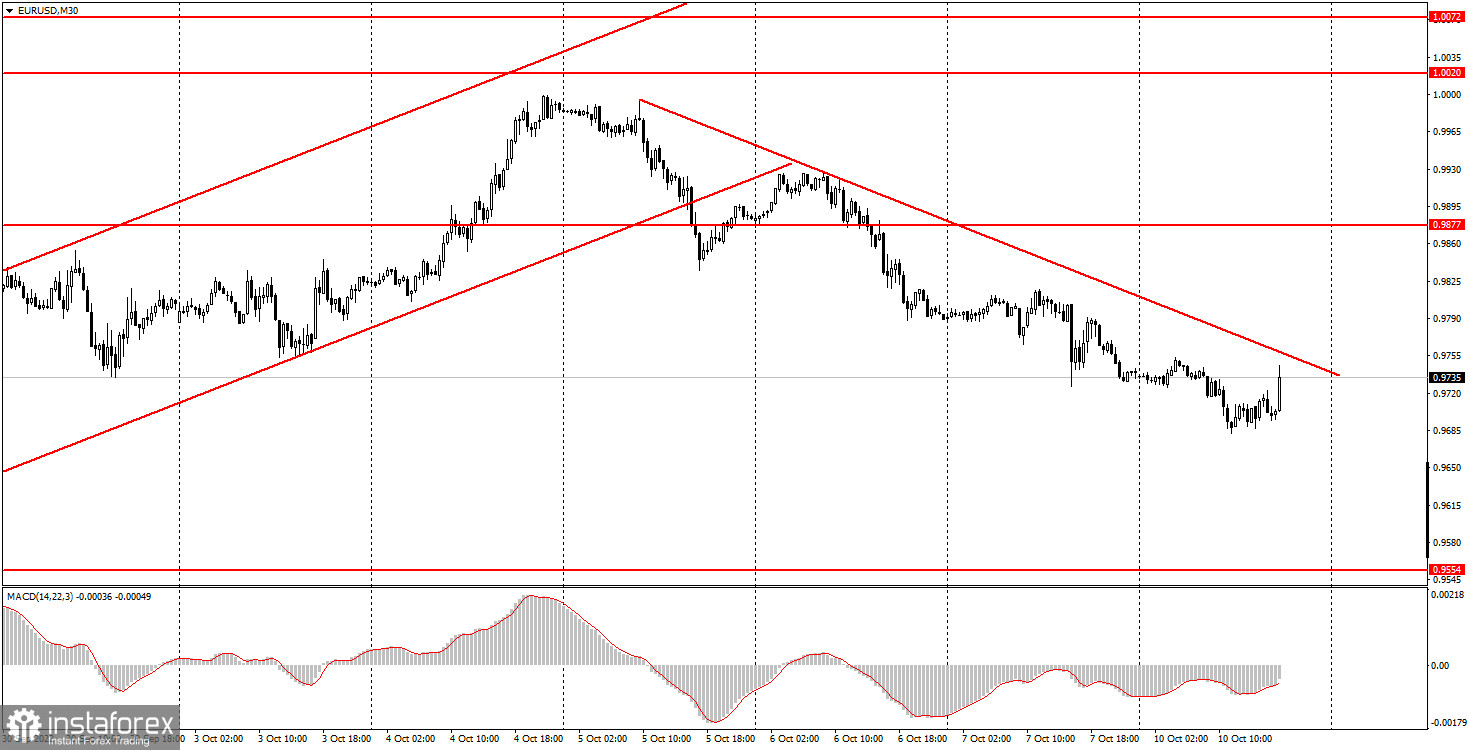
The EUR/USD currency pair traded quite calmly on Monday, but again with a decline. In principle, we talked about this the previous day: the intensity of trading should have fallen on an "empty" Monday. Nevertheless, even with the fall in volatility, the euro continues to remain below the trend line and fall. From our point of view, this only means one thing: the global downward trend will resume. More precisely, it has already resumed. The price is only 150 points away from its 20-year lows. Even if a new upward trend were starting at this time, it is virtually impossible to identify it from current moves. How can you talk about an upward trend if the price has been falling for four consecutive days and at the same time is near 20-year lows? As already mentioned, there were no macroeconomic events on Monday either in the US or in the EU. There was only an escalation of the conflict between Ukraine and Russia, as a result of which the G-7 summit was urgently convened. It is still unknown what decisions will be made, but we can state a fact: relations between the West and the Russian Federation will worsen even more. This potentially threatens a new fall of the euro as a risky currency.
5M chart of the EUR/USD pair
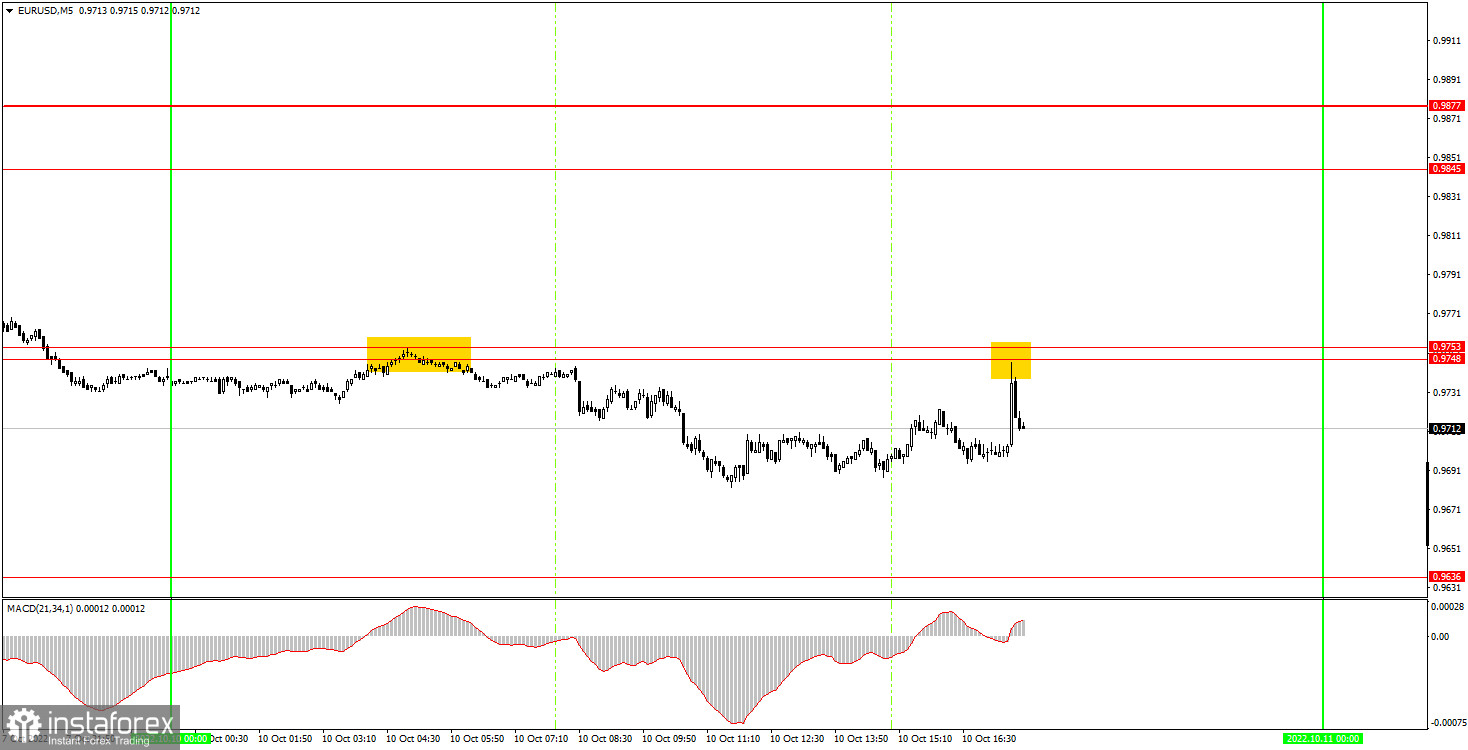
The movement on the 5-minute timeframe looked more like a flat than a trend. Two sell signals were formed during the day. Both times the price bounced off the 0.9748 level. The first time it happened at night, but at the time of the opening of the European trading session, the price did not go far from the formation point, so beginners could open a short position. However, it was possible to earn on it in case the position was manually closed, because the price failed to reach the target level of 0.9636. The same applies to the second sell signal, with the only difference being that it definitely had to be closed manually in the late afternoon, so a small profit could have been made on this position.
How to trade on Tuesday:
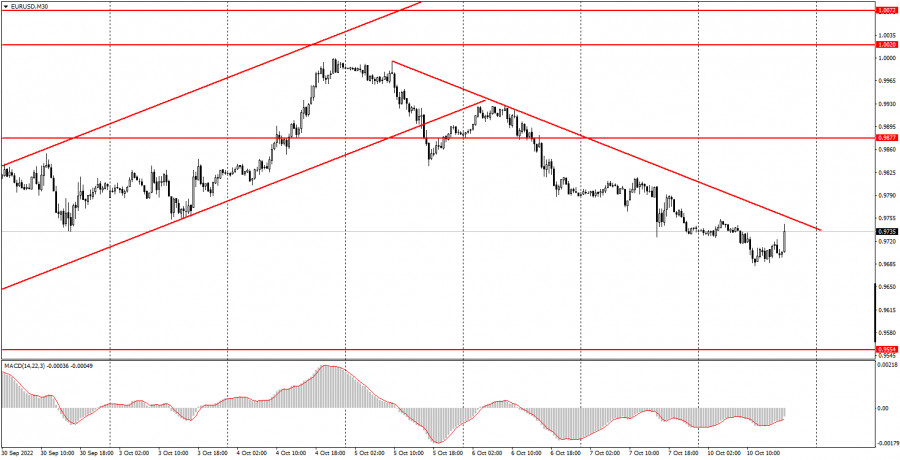
The pair continues its downward movement on the 30-minute timeframe. From our point of view, at a slow pace, the price may end up near the level of 0.9554 by the end of the week. It should be remembered that the probability of another 0.75% Federal Reserve rate hike is high, and this week's US inflation report may be disappointing. Geopolitics is deteriorating, so there is nothing left but to wait for a new fall from the euro. On the 5-minute TF on Tuesday it is recommended to trade at the levels of 0.9554, 0.9636, 0.9748-0.9753, 0.9845, 0.9877, 0.9952. When passing 15 points in the right direction, you should set Stop Loss to breakeven. Neither the EU nor the US again scheduled any important events. Thus, the market will again have nothing to react to, but the pair may continue to "slide" down.
Basic rules of the trading system:
1) The signal strength is calculated by the time it took to form the signal (bounce or overcome the level). The less time it took, the stronger the signal.
2) If two or more deals were opened near a certain level based on false signals (which did not trigger Take Profit or the nearest target level), then all subsequent signals from this level should be ignored.
3) In a flat, any pair can form a lot of false signals or not form them at all. But in any case, at the first signs of a flat, it is better to stop trading.
4) Trade deals are opened in the time period between the beginning of the European session and until the middle of the US one, when all deals must be closed manually.
5) On the 30-minute TF, using signals from the MACD indicator, you can trade only if there is good volatility and a trend, which is confirmed by a trend line or a trend channel.
6) If two levels are located too close to each other (from 5 to 15 points), then they should be considered as an area of support or resistance.
On the chart:
Support and Resistance Levels are the Levels that serve as targets when buying or selling the pair. You can place Take Profit near these levels.
Red lines are the channels or trend lines that display the current trend and show in which direction it is better to trade now.
The MACD indicator (14,22,3) consists of a histogram and a signal line. When they cross, this is a signal to enter the market. It is recommended to use this indicator in combination with trend lines (channels and trend lines).
Important speeches and reports (always contained in the news calendar) can greatly influence the movement of a currency pair. Therefore, during their exit, it is recommended to trade as carefully as possible or exit the market in order to avoid a sharp price reversal against the previous movement.
Beginners on Forex should remember that not every single trade has to be profitable. The development of a clear strategy and money management are the key to success in trading over a long period of time.