The pound has declined by almost 1% against the US dollar yesterday, which is due to uncertainty and fears about Brexit.
Although the historic deal between Great Britain and Europe took place, it is time to realize that not everything was as smooth as we would like it to be, and there was no clarity about the movement of financial institutions.
The service sector accounts for about 80% of the UK economy, banks, wealth managers and other financial institutions are alerting people on how to follow them and what to do in the future.
Rishi Sunak, Chancellor of the Treasury of Great Britain, said last Sunday that negotiations with Brussels over access to financial services will continue. At the same time, Britain and the EU hope to reach a Memorandum of Understanding on regulatory cooperation by March.
Low trading volumes worsened the pound's decline on Monday, as the UK market was closed for a public holiday.
On the other hand, the Committee of Permanent Representatives of the EU countries unanimously approved the trade agreement previously signed by the negotiator, but with one remark. The deal will come into effect on January 1 and will be provisionally applied until February 28. This was tweeted by Committee spokesman, Sebastian Fischer.
Following this report, the deal is approved retroactively, since the ratification in the EU parliament will only take place in March next year. The step is very interesting – either they already agreed on everything or we are waiting for an experimental period, where those who are dissatisfied with the deal may reappear.
Therefore, we will continue to monitor the information flow related to the Brexit topic.
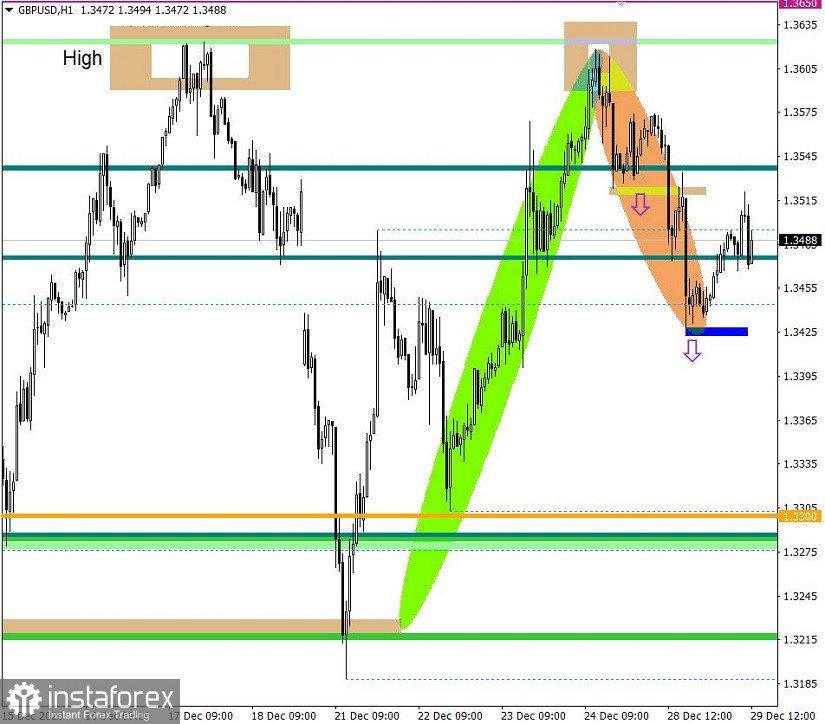
Yesterday, bearish activity was noticed in the market, which was due to the reason mentioned at the beginning of the article. Now, we will talk about the technical components. The resistance in the medium-term trend was the price area of 1.3600/1.3625, relative to which a downward move was set in the form of a correction. As a variable support, the coordinates of 1.3428 were used. In connection to this, there was a slight recovery relative to the correction course.
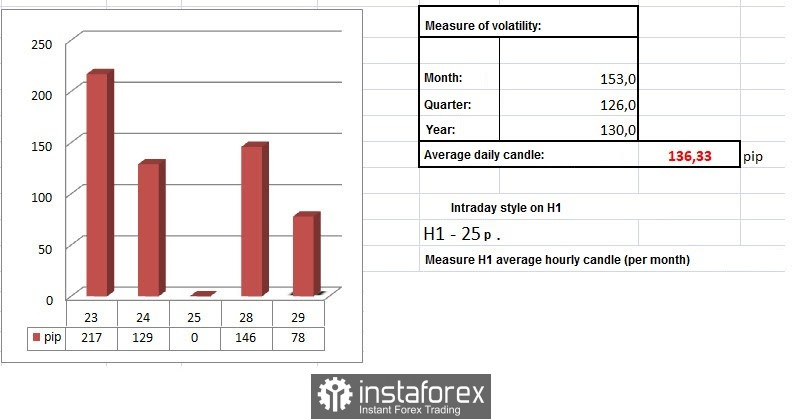
On December 28, the market dynamics was 146 points, which is 7% higher than the average. The speculative transaction coefficient continues to follow the high, even taking into account the fact that this is the last week of this year.
The trading recommendation for December 28 regarding the prolongation of the downward trend partially coincided, having an income on the trading deposit.
"We sell the currency pair at a price below 1.3520, with the prospect of moving to the range of 1.3470-1.3400."
Looking at the trading chart on a daily time frame, it can be seen that the correctional movement we are referring to above is just a stop at the high of the mid-term upward trend.
In terms of economic calendar, we only have US data for today, where the S&P/Case-Shiller house price index will be published, with a forecasted growth from 6.6% to 6.9%.
It is unlikely that someone will be interested in the house price index, since speculators will continue to monitor hot topics related to trade deal issues.
It can be assumed that in order for the correction to take the most clear forms, market participants need to stay below the level of 1.3420 in a four-hour time frame. In this case, the direction to the levels of 1.3320 - 1.3200 may open.
An alternative scenario considers a looped amplitude within the high of the medium-term trend, where market participants will wait for the coming of the new year.
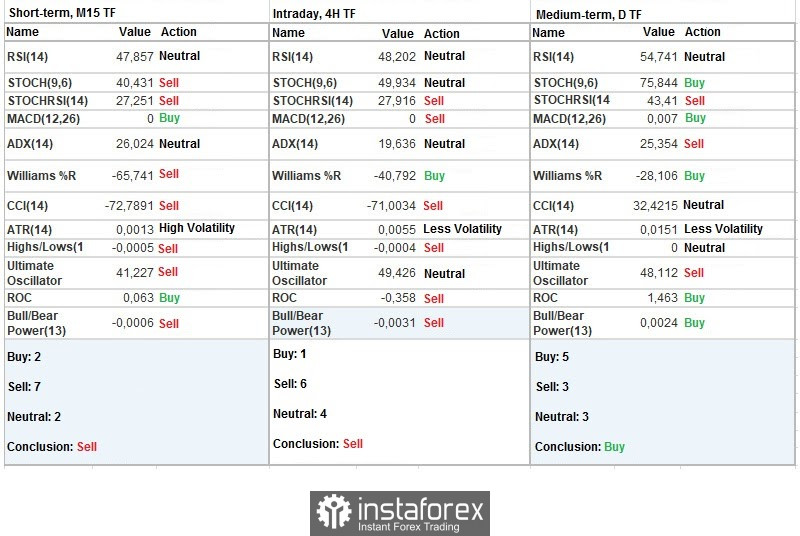
Indicator analysis
Analyzing different sectors of time frames (TF), it can be seen that the technical indicators of the instruments on the minute and hourly TFs signal a sell due to the correction process. The daily TF, in turn, signals a buy, due to the medium-term upward trend and the price upward movement.
Weekly volatility / Volatility measurement: Month; Quarter; Year
The volatility measurement reflects the average daily fluctuations, calculated per Month / Quarter / Year.
The dynamics of the current time is 78 points, which is still not enough for such a dynamic currency pair. Based on the statistical indicators of market volatility, the dynamics may still grow by 30-60 points.
Key levels
Resistance zones: 1.3650 **; 1.3850; 1.4000 ***; 1.4350 **.
Support zones: 1.3300 **; 1.3000 ***; 1.2840/1.2860 / 1.2885; 1.2770 **; 1.2620; 1.2500; 1.2350 **; 1.2250; 1.2150 **; 1.2000 *** (1.1957).
* Periodic level
** Range level
*** Psychological level