The past trading week gave an opportunity to earn even for the laziest traders. Price surges were observed almost on a daily basis, and volatility stably kept the bar above average. As a result, a high wave was caught, and the speculators, who became even richer than they were before, captured the market.
The US presidential elections is the reason for such a dynamic market, where everyone forgot about the problems of the world economy, COVID-19 pandemic, as well as third-party information flows. All the attention was focused on the vote count and the permanent statements of Trump and Biden.
Now, the 2020 election is coming to an end, where Mr. Biden finishes with a lead over his opponent, who received 290 votes from the electoral college against 270 necessary for victory. CNN, NBC and Fox News have already announced Biden's victory, which was criticized by the current President Donald Trump.
Mr. Trump said that elections are still on going, and Biden is not considered the winner of the race. The headquarters of the incumbent president plans to start fierce trials from November 9 to ensure that all legal ballots are counted and not legitimate canceled.
Trump's statements are loud, but even with the victory in Georgia and North Carolina, he will not be able to break away from Biden. Therefore, the result is already known.
Against this background, speculators have loosened their grip and no longer react aggressively to the announcement of Biden's victory in the 2020 elections, since everything is already known.
There was no market reaction at the opening of trading on November 9. The quote of the EUR/USD pair stood still, with no signs of bullish speculation.
It is worth noting that over the past week, an impressive layer of long positions was formed, which could lead to overheating in the market.
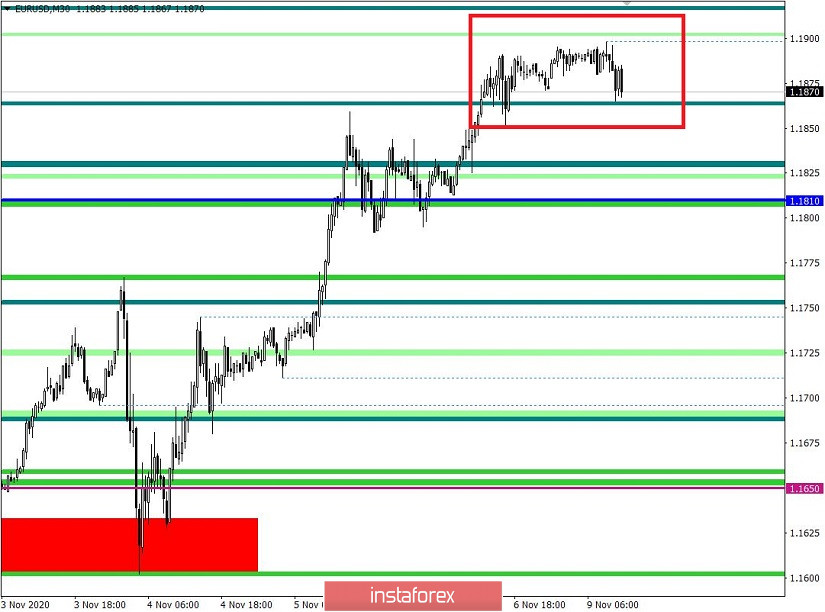
In terms of technical analysis, we should highlight the inertial price growth, which had a vertical shape from the level of 1.1602. The overbought rate of the single currency and the oversold state of the US dollar are clearly visible. Due to such an intense rise, the high (1.1880) on October 21 was locally overcome, but it seems that it's just a local slippage due to speculation.
Last week's trading recommendations took away most of the momentum, where the speculative approach turned out to be the most profitable method of operation.
As for last Friday's market dynamics, there is still an acceleration of 96 points, which is 23% higher than the average. Since the beginning of voting, the average dynamics is 129 points, which is considered a very high indicator for this pair.
At this time, the coefficient of speculative operations was at a high level, which was confirmed by the general dynamics of the market.
If we consider the trading chart in general terms (daily period), we should note that due to the rapid inertial movement of the Euro, it managed to restore its positions in the market, where a little more than 100 points of growth remained to update the high of the medium-term trend.
In terms of the economic calendar, there is no significant statistics for Europe and the US today, thus traders will continue to monitor the information flow regarding Trump and Biden.
Looking at the current trading chart, you can see the characteristic amplitude in the range of 1.1860/1.1900, where compression is fixed, which can eventually lead to acceleration in the market if the price goes out of the set limits.
The trading tactic is based on the breakout method, where the starting points can be the coordinates 1.1910 for buying and 1.1845 for selling.
As before, the speculative hype will have a permanent basis depending on the incoming information regarding the statements of Trump and Biden.
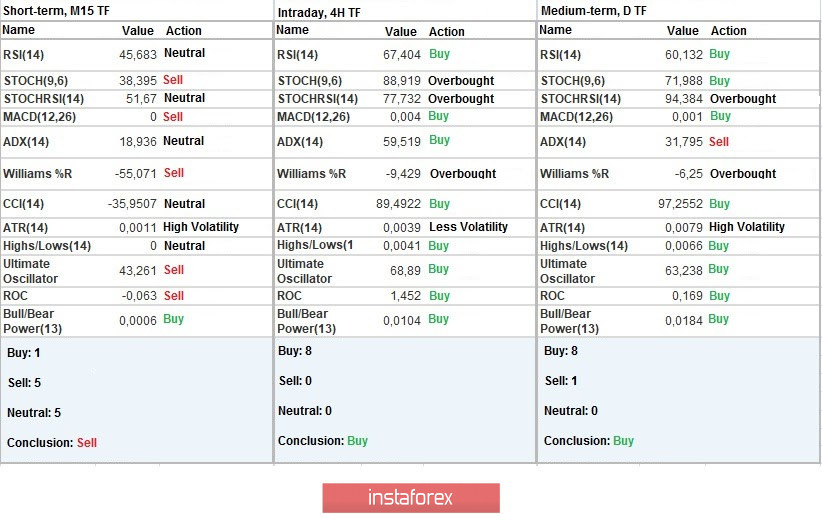
Indicator analysis
Analyzing different sectors of time frames (TF), we can see that technical indicators, as before, tend to buy due to price consolidation at the conditional peak of the inertial move. Meanwhile, minute TF have a variable signal due to price movement within the amplitude.
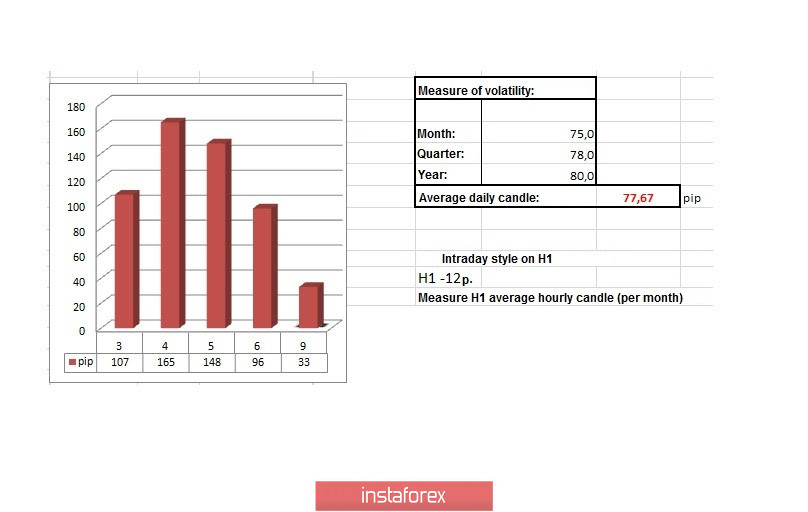
Weekly volatility / Volatility measurement: Month; Quarter; Year
Measurement of volatility reflects the average daily fluctuation, calculated per Month / Quarter / Year.
The current dynamics is 33 pips, which is clearly considered a low indicator compared with last week's dynamics. We can assume that breaking through the current range may give an additional incentive to speculators, which will lead to a local acceleration in the market.
Key levels
Resistance zones: 1.1910; 1.2000 ***; 1.2100 *; 1.2450 **; 1.2550; 1.2825.
Support zones: 1.1880; 1.1700; 1.1612*; 1.1500; 1.1350; 1.1250*; 1.1180 **; 1.1080; 1.1000***.
* Periodic level
** Range level
*** Psychological level