For the last 44 hours, price fluctuations were so strong that it might seem for a moment that there was a certain inertia. The information background along with intense speculation played a dirty trick to the market. As a result, a V-shaped pattern ( 1.1767 - 1.1602 - 1.1767) was formed.
From the point of view of technical analysis, it is impossible to explain the reason for such a drastic change, since fundamental analysis, in particular noisy data, serves as a lever for manipulations.
Thus, speculators are supported by the drama of the presidential election in the United States. Consequently, any incoming information about the vote count is perceived by market participants as a call to action.
In the previous review, I said a few words about the candidates and the greenback's reaction to both them. I would like to remind you about the essence of my previous review. Biden's victory could lead to the weakening of the US dollar due to uncertainty surrounding the future of the American economy. Investors are getting used to stability and have an idea about Donald Trump's actions in case of victory. Therefore, the win of the current president may lead to a rise in the US dollar.
The outcome of the presidential election is hampered by the counting of votes, since almost half of the voters chose to vote by mail instead of visiting polling stations.
It is extremely difficult to draw any conclusions. The gap between the candidates is small and everything can change at any moment. Investors are monitoring the incoming information and are in no hurry to take action unlike speculators who use the thin market and noise to their advantage.
Given such intense activity, there is no point in using the entire volume of capital, as it can lead to substantial losses in case of lack of the speculative tact.
In order to identify noisy data as early as possible, I advise you to use sources such as Bloomberg, Wall Street Journal, Reuters when you are analyzing the burning topic of elections.
As for the market dynamics, the crucial moment was when the market stopped on November 2. That day, volatility was only 33 pips, which was considered an extremely low value.
In fact, it was a sign that speculators were preparing for the upcoming vote.
November 3 was a voting day. The market activity was 107 pips, which was 40 pips above the average level.
On November 4, the first results were announced. Volatility amounted to 165 pips for the first time in 109 days, which was 116% higher than the average level.
Analyzing the trading chart in general terms (daily period), it is worth mentioning that the medium-term trend remains sideways, while the level of 1.1612 serves as a variable support.
As for the economic calendar, there is a Federal Open Market Committee meeting. The regulator is unlikely to make any crucial decisions until the counting of votes is finished. The topic of the election is considered to be the main one. Therefore, the meeting and macroeconomic statistics are of secondary importance.
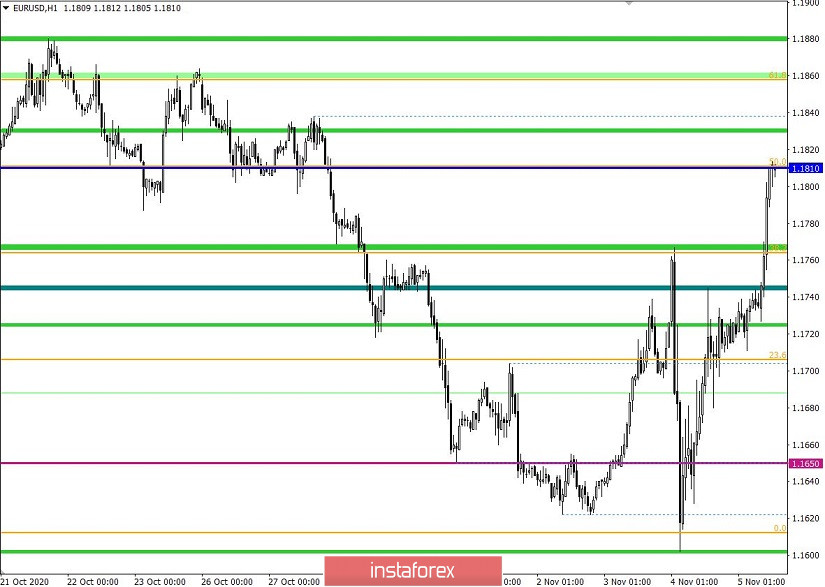
Analyzing the current trading chart, you can notice that with the start of the European session, the price resumed its upward movement. That led to a breakout at the local high of 1.1767. Apart from that, the formation of a V-shaped pattern (1.1767 - 1.1602 - 1.1767) ended after a breakout of its upper border.
Notably, a wave of speculation took place when it was announced that Joe Biden was leading. As a result, the US dollar started to weaken.
Most likely, price fluctuations will last until the winner of the presidential race is determined.
Levels of interaction between the price and market participants:
1.1810 and 1.1880 - reduction in the volume of long positions
1.1750, 1.1700, and 1.1650 - reduction in the volume of short positions
That is, we are talking about the points of partial and complete closure of speculators' positions. This can help us place new orders.
Buy/sell recommendations:
Consider opening Long positions above the level of 1.1825 with the view of reaching the area of 1.1850-1.1880.
Consider opening Short positions below the level of 1.1790 with the view of reaching the area of 1.1750 - 1.1700.
Indicator analysis
Analyzing different sectors of time frames (TF), it becomes clear that the technical tools are giving a buy signal. However, due to high volatility, false market direction signals are not excluded, which is common to tools when the level of speculation is increasing.
Weekly volatility/Measure of Volatility: Month; Quarter; Year
Measure of Volatility reflects the average daily price fluctuation per Month / Quarter / Year.
The current dynamics is 103 pips, which is 34% higher than the average level. Volatility may continue rising along with the flow of speculations in the market.
Key levels
Resistance zones: 1.1880; 1.1910; 1.2000***; 1.2100*; 1.2450**; 1.2550; 1.2825.
Support Zones: 1,1700; 1.1612*; 1.1500; 1.1350; 1.1250*; 1.1180**; 1.1080; 1.1000***.
* Periodic level
** Range level
*** Psychological level