empty
 
 
21.02.2022: ফরেক্স বিশ্লেষণ এবং পর্যালোচনা: Technical Analysis of EUR/USD for February 21, 2022
loader
ইন্সটাফরেক্স দৈনিক বিশ্লেষণ (১৯ মে, ২০২০)
2020-05-19 UTC+3
ইন্সটাফরেক্স দৈনিক বিশ্লেষণ - ১৮ মে, ২০২০
2020-05-18 UTC+3
ইন্সটাফরেক্স দৈনিক বিশ্লেষণ - (১৪ মে, ২০২০)
2020-05-14 UTC+3
ইন্সটাফরেক্স দৈনিক বিশ্লেষণ - 13 মে 2020
2020-05-13 UTC+3
ইন্সটাফরেক্স দৈনিক বিশ্লেষণ - 12 শে মে 2020
2020-05-12 UTC+3
ইন্সটাফরেক্স প্রতিদিনের বিশ্লেষণ -১১ মে ২০২০
2020-05-11 UTC+3
ইন্সটাফরেক্স দৈনিক বিশ্লেষণ - 6 মে 2020
2020-05-06 UTC+3
ইন্সটাফরেক্স দৈনিক বিশ্লেষণ - 4 মে 2020
2020-05-04 UTC+3
ইন্সটাফরেক্স ডেইলি বিশ্লেষণ - ৩০ এপ্রিল, ২০২০
2020-04-30 UTC+3
ইন্সটাফরেক্স প্রতিদিনের বিশ্লেষণ -২৯ এপ্রিল ২০২০
2020-04-29 UTC+3
ইন্টাফরেক্স প্রতিদিনের বিশ্লেষণ -২৭ এপ্রিল ২০২০
2020-04-27 UTC+3
ইন্সটাফরেক্স দৈনিক বিশ্লেষণ - (২৩ এপ্রিল, ২০২০)
2020-04-23 UTC+3
ইন্সটাফরেক্স দৈনিক বিশ্লেষণ - ২২ এপ্রিল, ২০২০
2020-04-22 UTC+3
ইন্সটাফরেক্স প্রতিদিনের বিশ্লেষণ - 21st এপ্রিল 2020
2020-04-21 UTC+3
ইন্সটাফরেক্স প্রতিদিনের বিশ্লেষণ - 21st এপ্রিল 2020
2020-04-21 UTC+3
ইন্সটাফরেক্সের প্রতিদিনের বিশ্লেষণ -১৬ এপ্রিল ২০২০
2020-04-16 UTC+3
ইন্সটাফরেক্সের দৈনিক বিশ্লেষণ - ১৫ এপ্রিল, ২০২০
2020-04-15 UTC+3
ইন্সটাফরেক্স দৈনিক বিশ্লেষণ (১৩ এপ্রিল, ২০২০)
2020-04-13 UTC+3

Technical Market Outlook

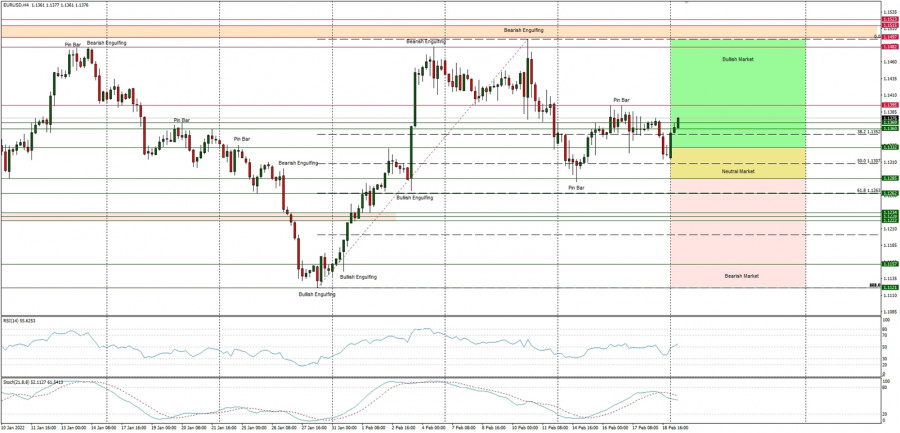
The EUR/USD pair has bounced from the level of 1.1307 and is back inside the green zone. The bulls target is seen at the level of 1.1395 (technical resistance), but to break through, the bulls need more momentum. The key t target for EUR/USD bulls is the short-term supply zone located between the levels of 1.1497 - 1.1513 and if this zone is clearly violated, then the market might continue the up move for the longer period of time. This is why this zone is so important and bears are defending the zone quite effectively. Please notice, that the bearish zone starts with the level of 1.1285.

Weekly Pivot Points:

WR3 - 1.1488

WR2 - 1.1410

WR1 - 1.1376

Weekly Pivot - 1.1327

WS1 - 1.1259

WS2 - 1.1208

WS3 - 1.1144

Trading Outlook:

The recent big Bullish Engulfing candlestick pattern seen at the weekly time frame chart indicates a strong rebound, but the market is still in control by bears that pushed the price way below the level of 1.1501, so a breakout above this level is a must for bulls for a trend reversal. The next long-term technical support is located at 1.1167. The up trend can be continued towards the next long-term target located at the level of 1.2350 (high from 06.01.2021) only if bullish cycle scenario is confirmed by breakout above the level of 1.1501 and 1.1599, otherwise the bears will push the price lower towards the next long-term target at the level of 1.1166.

analytics62134afb45971.jpg

*এখানে পোস্ট করা মার্কেট বিশ্লেষণ আপনার সচেতনতা বৃদ্ধির জন্য প্রদান করা হয়, ট্রেড করার নির্দেশনা প্রদানের জন্য প্রদান করা হয় না।

  • Grand Choice
    Contest by
    InstaForex
    InstaForex always strives to help you
    fulfill your biggest dreams.
    প্রতিযোগীতায় অংশগ্রহণ করুন
  • চ্যান্সি ডিপোজিট
    আপনার অ্যাকাউন্টে $3,000 জমা করুন এবং $10000 এর অধিক নিন!
    চ্যান্সি ডিপোজিট প্রচারাভিযানে আমরা জানুয়ারি $10000 লটারি করেছি! একটি ট্রেডিং অ্যাকাউন্টে $3,000 জমা করে এই অর্থ জেতার একটি সুযোগ নিন! এই শর্ত পূরণ করে, আপনি একজন অংশগ্রহণকারী হতে পারবেন।
    প্রতিযোগীতায় অংশগ্রহণ করুন
  • বুদ্ধিমত্তার সাথে ট্রেড করুন, ডিভাইস জিতুন
    আপনার অ্যাকাউন্টে কমপক্ষে $৫০০ টপ আপ করুন, প্রতিযোগিতার জন্য সাইন আপ করুন এবং মোবাইল ডিভাইস জেতার সুযোগ পান।
    প্রতিযোগীতায় অংশগ্রহণ করুন
  • ১০০% বোনাস
    আপনার ডিপোজিটের উপর ১০০% বোনাস পাওয়ার অনন্য সুযোগ
    বোনাস পান
  • ৫৫% বোনাস
    আপনার অ্যাকাউন্টে প্রতিটি ডিপোজিটের উপর ৫৫% বোনাসের জন্য আবেদন করুন
    বোনাস পান
  • ৩০% বোনাস
    প্রতিবার আপনার অ্যাকাউন্ট টপ আপ করার সময় ৩০% বোনাস নিন
    বোনাস পান
এখন কথা বলতে পারবেন না?
আপনার প্রশ্ন জিজ্ঞাসা করুন চ্যাট.
Widget callback