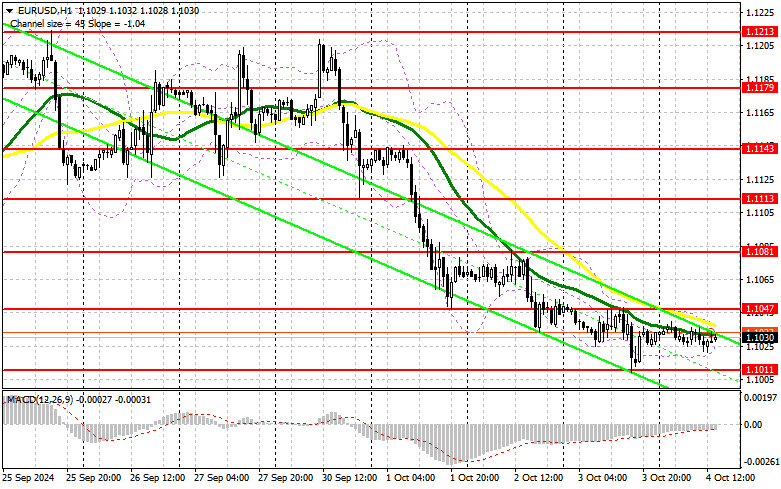
In my morning forecast, I highlighted the level of 1.1047 and planned to make market entry decisions based on it. Let's take a look at the 5-minute chart to analyze what happened there. There was an increase, but due to the extremely low market volatility, we did not reach the test of 1.1047. The technical picture for the second half of the day has not changed.
To Open Long Positions on EUR/USD:
A decrease in the unemployment rate and an increase in the number of jobs in the non-farm sector in the U.S. in September this year would be favorable for dollar buyers, leading to significant selling pressure on EUR/USD. Attention should also be paid to the figures for the change in average hourly earnings and the speech of FOMC member John Williams, who may comment on the new data. If the pair declines, it would be best to act as close to the support level as possible, around 1.1011. A false breakout there would create a suitable condition for increasing long positions and would open the way to the level of 1.1047, which was not surpassed yesterday. A breakout and a reverse test of this range against weak data would confirm the right entry point for buying, with the target of updating 1.1081; this would allow buyers to recover a bit. The furthest target would be the maximum at 1.1113, where I will take profit. If EUR/USD continues to decline and there is no activity around 1.1011 in the second half of the day, pressure on the euro will return. In this case, I will only enter after a false breakout at the next support level of 1.0979. I plan to open long positions immediately on a rebound from 1.0979 with a target of upward correction of 30-35 points within the day.
To Open Short Positions on EUR/USD:
Sellers maintain control over the market ahead of important data, but only strong statistics will be able to lead to a significant sell-off of the euro. A false breakout around 1.1047 would provide a good entry point for opening new short positions, with the potential for further decline to the support level of 1.1011. A breakout and consolidation below this range, along with a reverse test from below, would give another point to sell, moving towards the area of 1.0979, which would be quite a serious blow to euro buyers' positions. Therefore, I expect to see their more active presence there. The furthest target would be the area of 1.0952, where I will take profit. Testing this level will reinforce the bearish trend for the euro. In the event of an upward movement of EUR/USD in the second half of the day, and the absence of bears at 1.1047, buyers will be able to regain the initiative, gaining a chance for an upward rally. In this case, I will postpone selling until testing the next resistance at 1.1081. I will also sell there, but only after an unsuccessful consolidation. I plan to open short positions immediately on a rebound from 1.1113, targeting a downward correction of 30-35 points.
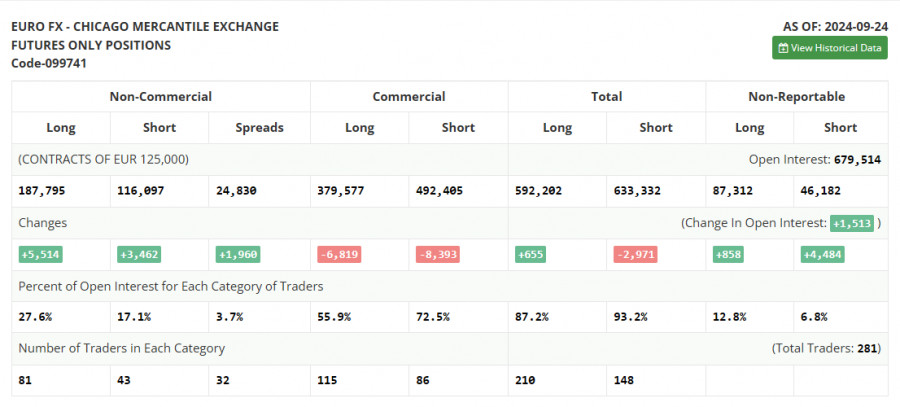
In the COT report (Commitment of Traders) for September 24, there was a slight increase in both long and short positions, which helped maintain the balance of power on the side of risk asset buyers. It is evident that the Federal Reserve's decision to lower rates by 0.5% will continue to attract new buyers of the euro and force the dollar to be sold, as the chances for a more aggressive easing of policy in November remain high. The Fed's future actions will depend on labor market data, with a significant amount being released soon. I will rely on this data when developing my strategy for trading the euro. However, this does not negate the medium-term upward trend for the pair, and the lower the pair goes, the more attractive it will be for purchases. The COT report indicates that long non-commercial positions increased by 5,514 to a level of 187,795, while short non-commercial positions rose by 3,462 to a level of 116,097. As a result, the gap between long and short positions increased by 1,960.
Indicator Signals:
Moving Averages
Trading is currently below the 30 and 50-day moving averages, indicating a decline in the euro.
Note: The periods and prices of the moving averages are considered by the author on the hourly chart H1 and differ from the general definition of classic daily moving averages on the daily chart D1.
Bollinger Bands
In the event of a decline, the lower boundary of the indicator around 1.1028 will serve as support.
Description of Indicators:
- Moving Average: (average, determines the current trend by smoothing volatility and noise). Period 50. Marked in yellow on the chart.
- Moving Average: (average, determines the current trend by smoothing volatility and noise). Period 30. Marked in green on the chart.
- MACD Indicator: (Moving Average Convergence/Divergence — convergence/divergence of moving averages). Fast EMA period 12. Slow EMA period 26. SMA period 9.
- Bollinger Bands: Period 20.
- Non-commercial traders: speculators such as individual traders, hedge funds, and large institutions using the futures market for speculative purposes and meeting specific requirements.
- Long non-commercial positions: represent the total long open position of non-commercial traders.
- Short non-commercial positions: represent the total short open position of non-commercial traders.
- Total non-commercial net position: the difference between short and long positions of non-commercial traders.