Bitcoin has been in a continuous rally cycle for two weeks. During this period, the price managed to rise by 30% and reached a five-month peak at around $57.2k. However, on October 12, the cryptocurrency began to decline in price and eventually bounced to the support zone at $55.5k, which it subsequently also broke through. Despite this, the asset is still in the bullish trend, but in order to determine the next "plans" of the coin, it is necessary to conduct a technical analysis, since the network metrics of the cryptocurrency remain at about the same level.
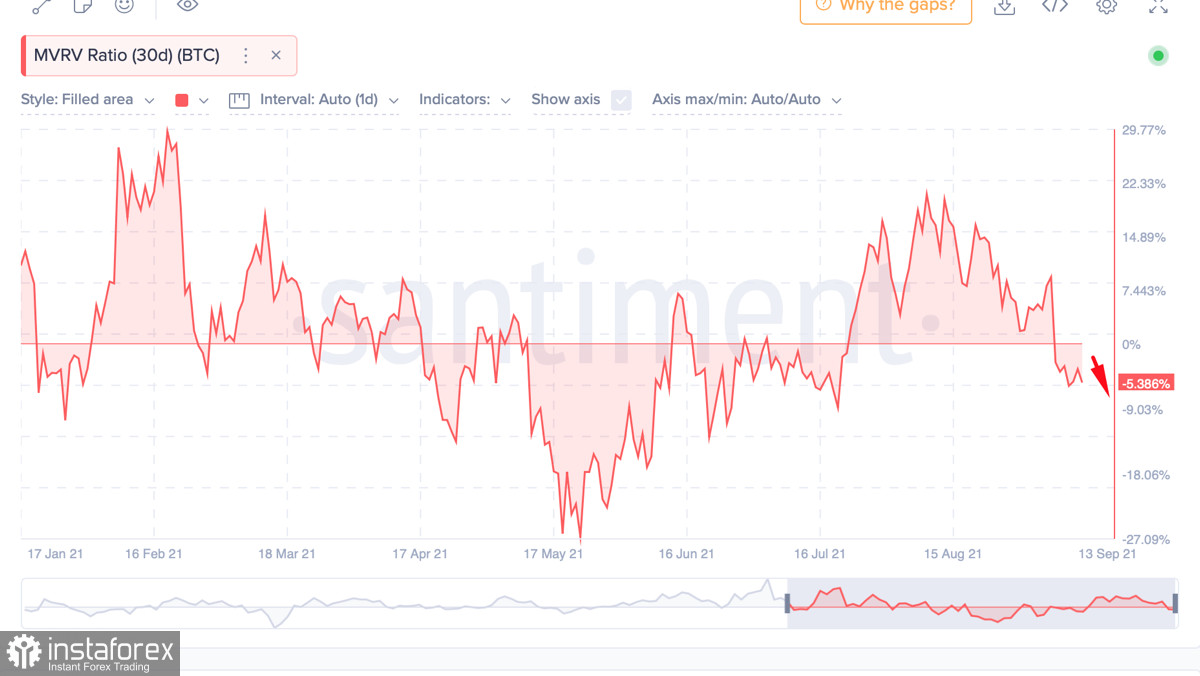
An important factor to consider when analyzing the fall and the current state of BTC is the research of the analytical company B2C2. Experts are sure that over the past two weeks, the retail audience has been actively selling bitcoins, while large companies have continued to increase volumes. In the previous analysis, we stopped at the indicator of the ratio of the realized and market value of BTC, which turned out to be below zero, which just indicated the sale of coins by individual traders. It is worth noting that this metric continued its downward movement and reached -5%, which indicates that the trend towards sales is continuing.
*Learn and analyze
MVRV (Market Value to Realized Value) indicator - the indicator displays the ratio of the market and realized value of a particular cryptocurrency. This metric gives a more objective view of the current value of the coin and the period of the market. The indicator also displays the results of the movement of coins: if the value is below 0, then the players moved coins with a loss, and if it is above 0, then investors have made a profit from operations with coins.
Relative Strength Index (RSI) is a technical indicator that allows you to determine the strength of a trend (downward or upward trend), warns of possible changes in the direction of price movement. Thanks to this metric, it is possible to determine in what stage the asset is - overbought or underbought. The optimal mark for this chart is 60 for a bullish trend. It indicates strong demand for the coin and the strength of the current upward momentum. Upon crossing this mark, the coin begins to move towards overbought.
MACD (Moving Average Convergence Divergence Index) is an indicator that allows you to draw certain conclusions about the trend based on the movement of moving averages and finding the metric values between them. A common bullish signal is the intersection of the white line below the red and bearish, on the contrary, when the white line crosses the red from above, which indicates a downward movement.
Stochastic (Stochastic Oscillator) - the indicator indicates the strength of the momentum of the current prevailing trend. If the indicator is above 80, then the asset can be considered overbought, but if the stochastic is below 20, then this is a signal that the asset is oversold.
Super trend line is a technical indicator that reflects a bullish (green - a buy signal) and bearish (red - a sell signal) trend on the horizontal charts of a cryptocurrency.
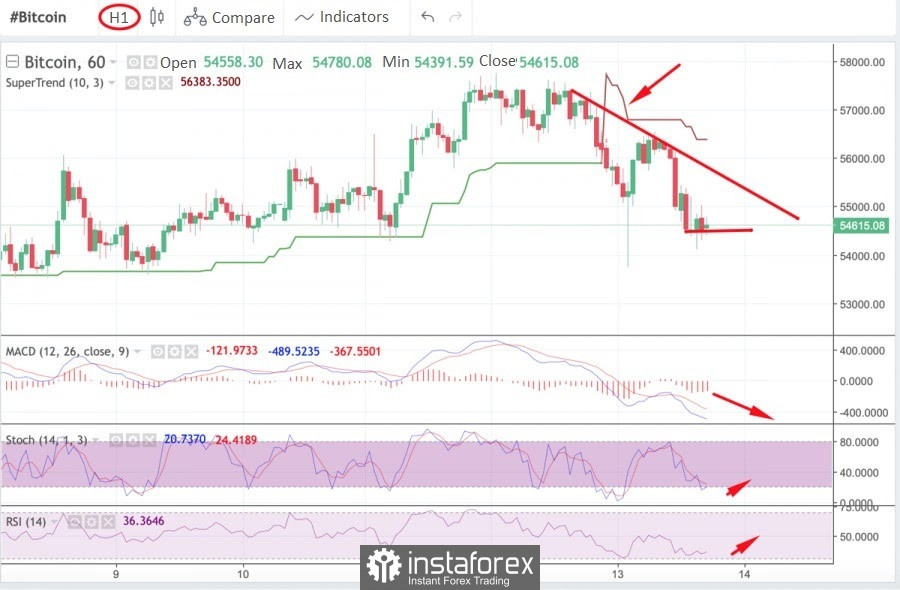
Bitcoin's sudden sell-off from retail traders freed up large volumes of coins that began to put pressure on the price. It was at this point that the price of BTC hit a five-month high of $57.2k. As a result, there was a situation in which a local sell-off exacerbated the correction, and the price of the cryptocurrency began to decline rapidly. Based on the hourly chart, the recovery period will not take long, and the coin's performance has already begun to recover.
Despite this, the price has broken through the super trend line and is trying to climb to the $55k mark, which now serves as resistance and puts pressure on the price. The technical indicators of the cryptocurrency demonstrate the prerequisites for the possible launch of a bullish wave due to the formation of a bullish crossover according to the stochastic oscillator. The relative strength index also began to recover and is moving towards 60. At the same time, the MACD crossed the zero mark and continues its downward movement. On the hourly chart, the coin found a local bottom at $54.6k and is trying to stabilize the price to climb to $55k.
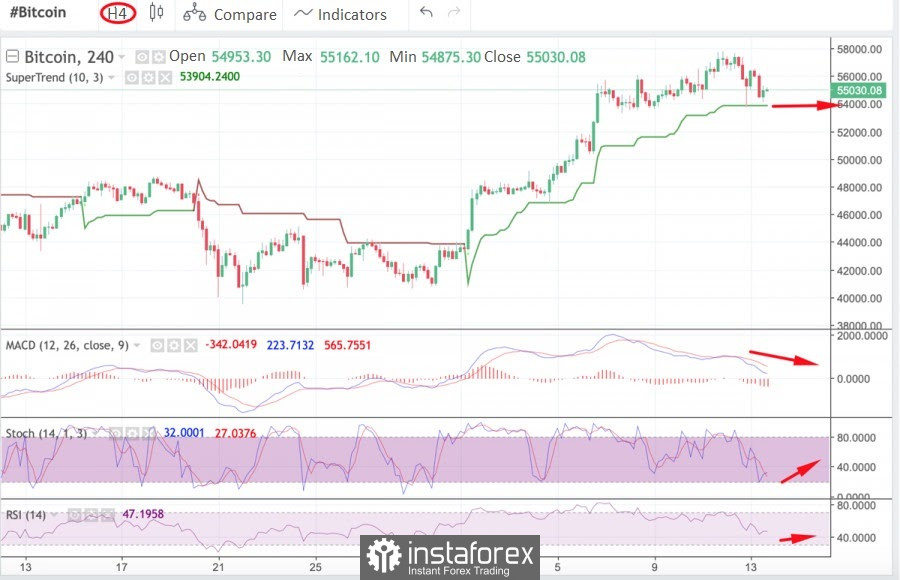
On the four-hour chart, the situation looks less encouraging. If on the hourly timeframe the stochastic oscillator was approaching an upward movement through the formation of a bullish crossover, then in a wider range this bullish impulse has already lost its strength. The same is confirmed by the index of relative strength moving in the sideways direction and the preserving the downward movement of the MACD. However, the price manages to stay above the super trend line, which indicates that the upward movement of bitcoin is preserved, and if the situation worsens, the main task of the market will be to keep BTC above this line.

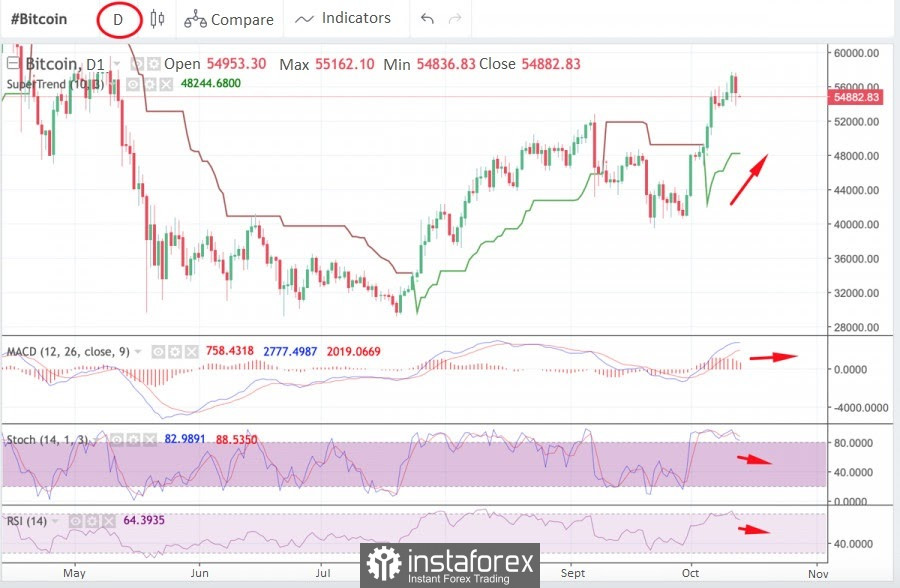
The daily chart shows the preconditions for price stabilization and the beginning of the accumulation period. This can be seen from the systematic decline in the main technical indicators. The MACD indicator starts a sideways movement, while the Stochastic and RSI index are dropping to acceptable levels around 60. The price is also above the super trend line, which indicates the continued upward movement, within which a local collapse occurred. Despite this, the asset found the bottom and is trying to form support zones for the start of the accumulation period and subsequent unhurried growth to the previous positions.
The main task of the minimum for BTC today is to hold the $54k milestone and for the maximum to consolidate above $55k. At the same time, the likelihood of a subsequent collapse remains, since the trend towards sales on cryptocurrency platforms does not subside, and therefore, a signal for a long should be taken to overcome the $55.5k boundary and successfully consolidate above it. A fall over $54k will exacerbate the correction and encourage further movement towards local lows.